Hi,
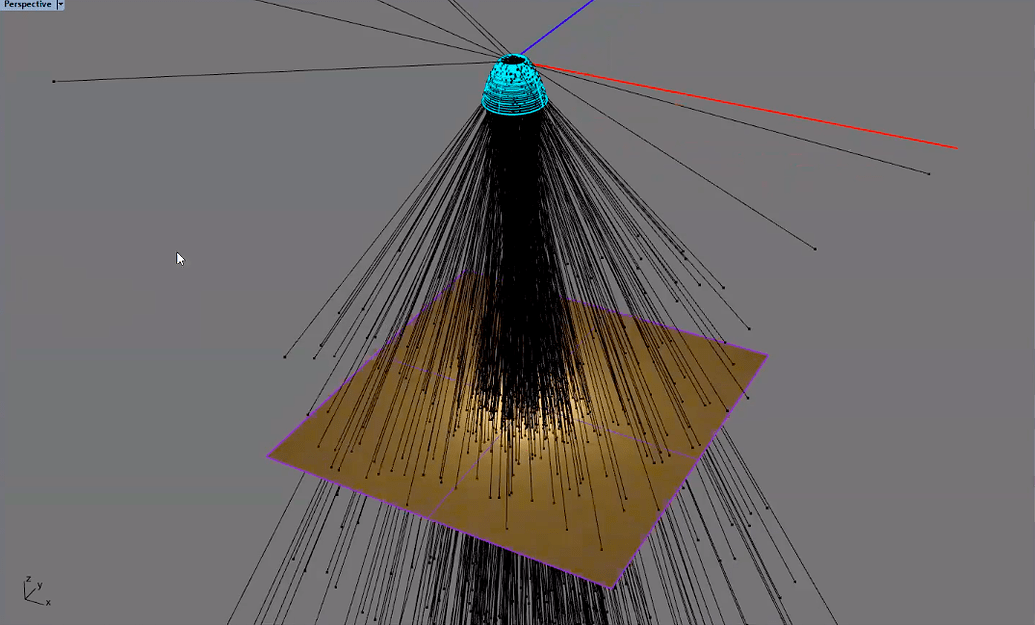
I am looking for a way to display the distribution of a lights as lines/vectors, given an available IES file. I see that Honeybee comes with 4 IES components but none of these has this option. Is there a know workaround to get this data?
I run Rhino 7. Here is an example of what I aim to achieve
PS. I was unaware Honeybee has these componets to read IES, so I posted similar post in GH forum. I’ll delete that one as I expect these HB components might be the way forward