First, the drafonfly documentation (dragonfly_uwg.traffic module — dragonfly-uwg documentation) refers to Sailor (2011) for additional city level sensible anthropogenic heat flux values. However, the reference does not contain such list or data.
Second, it would be interesting to know from where or how have the hourly schedule been derived. To my knowledge, the schedule was first implemented in the model by Joseph H. Yang (see his MIT thesis, 2016). However, the image in his work—depicting the daily schedule—was not referenced. The only referenced work in the thesis is that of Quah & Roth (2012), which does not include that specific schedule. If anybody has some information about this, it would be fantastic!
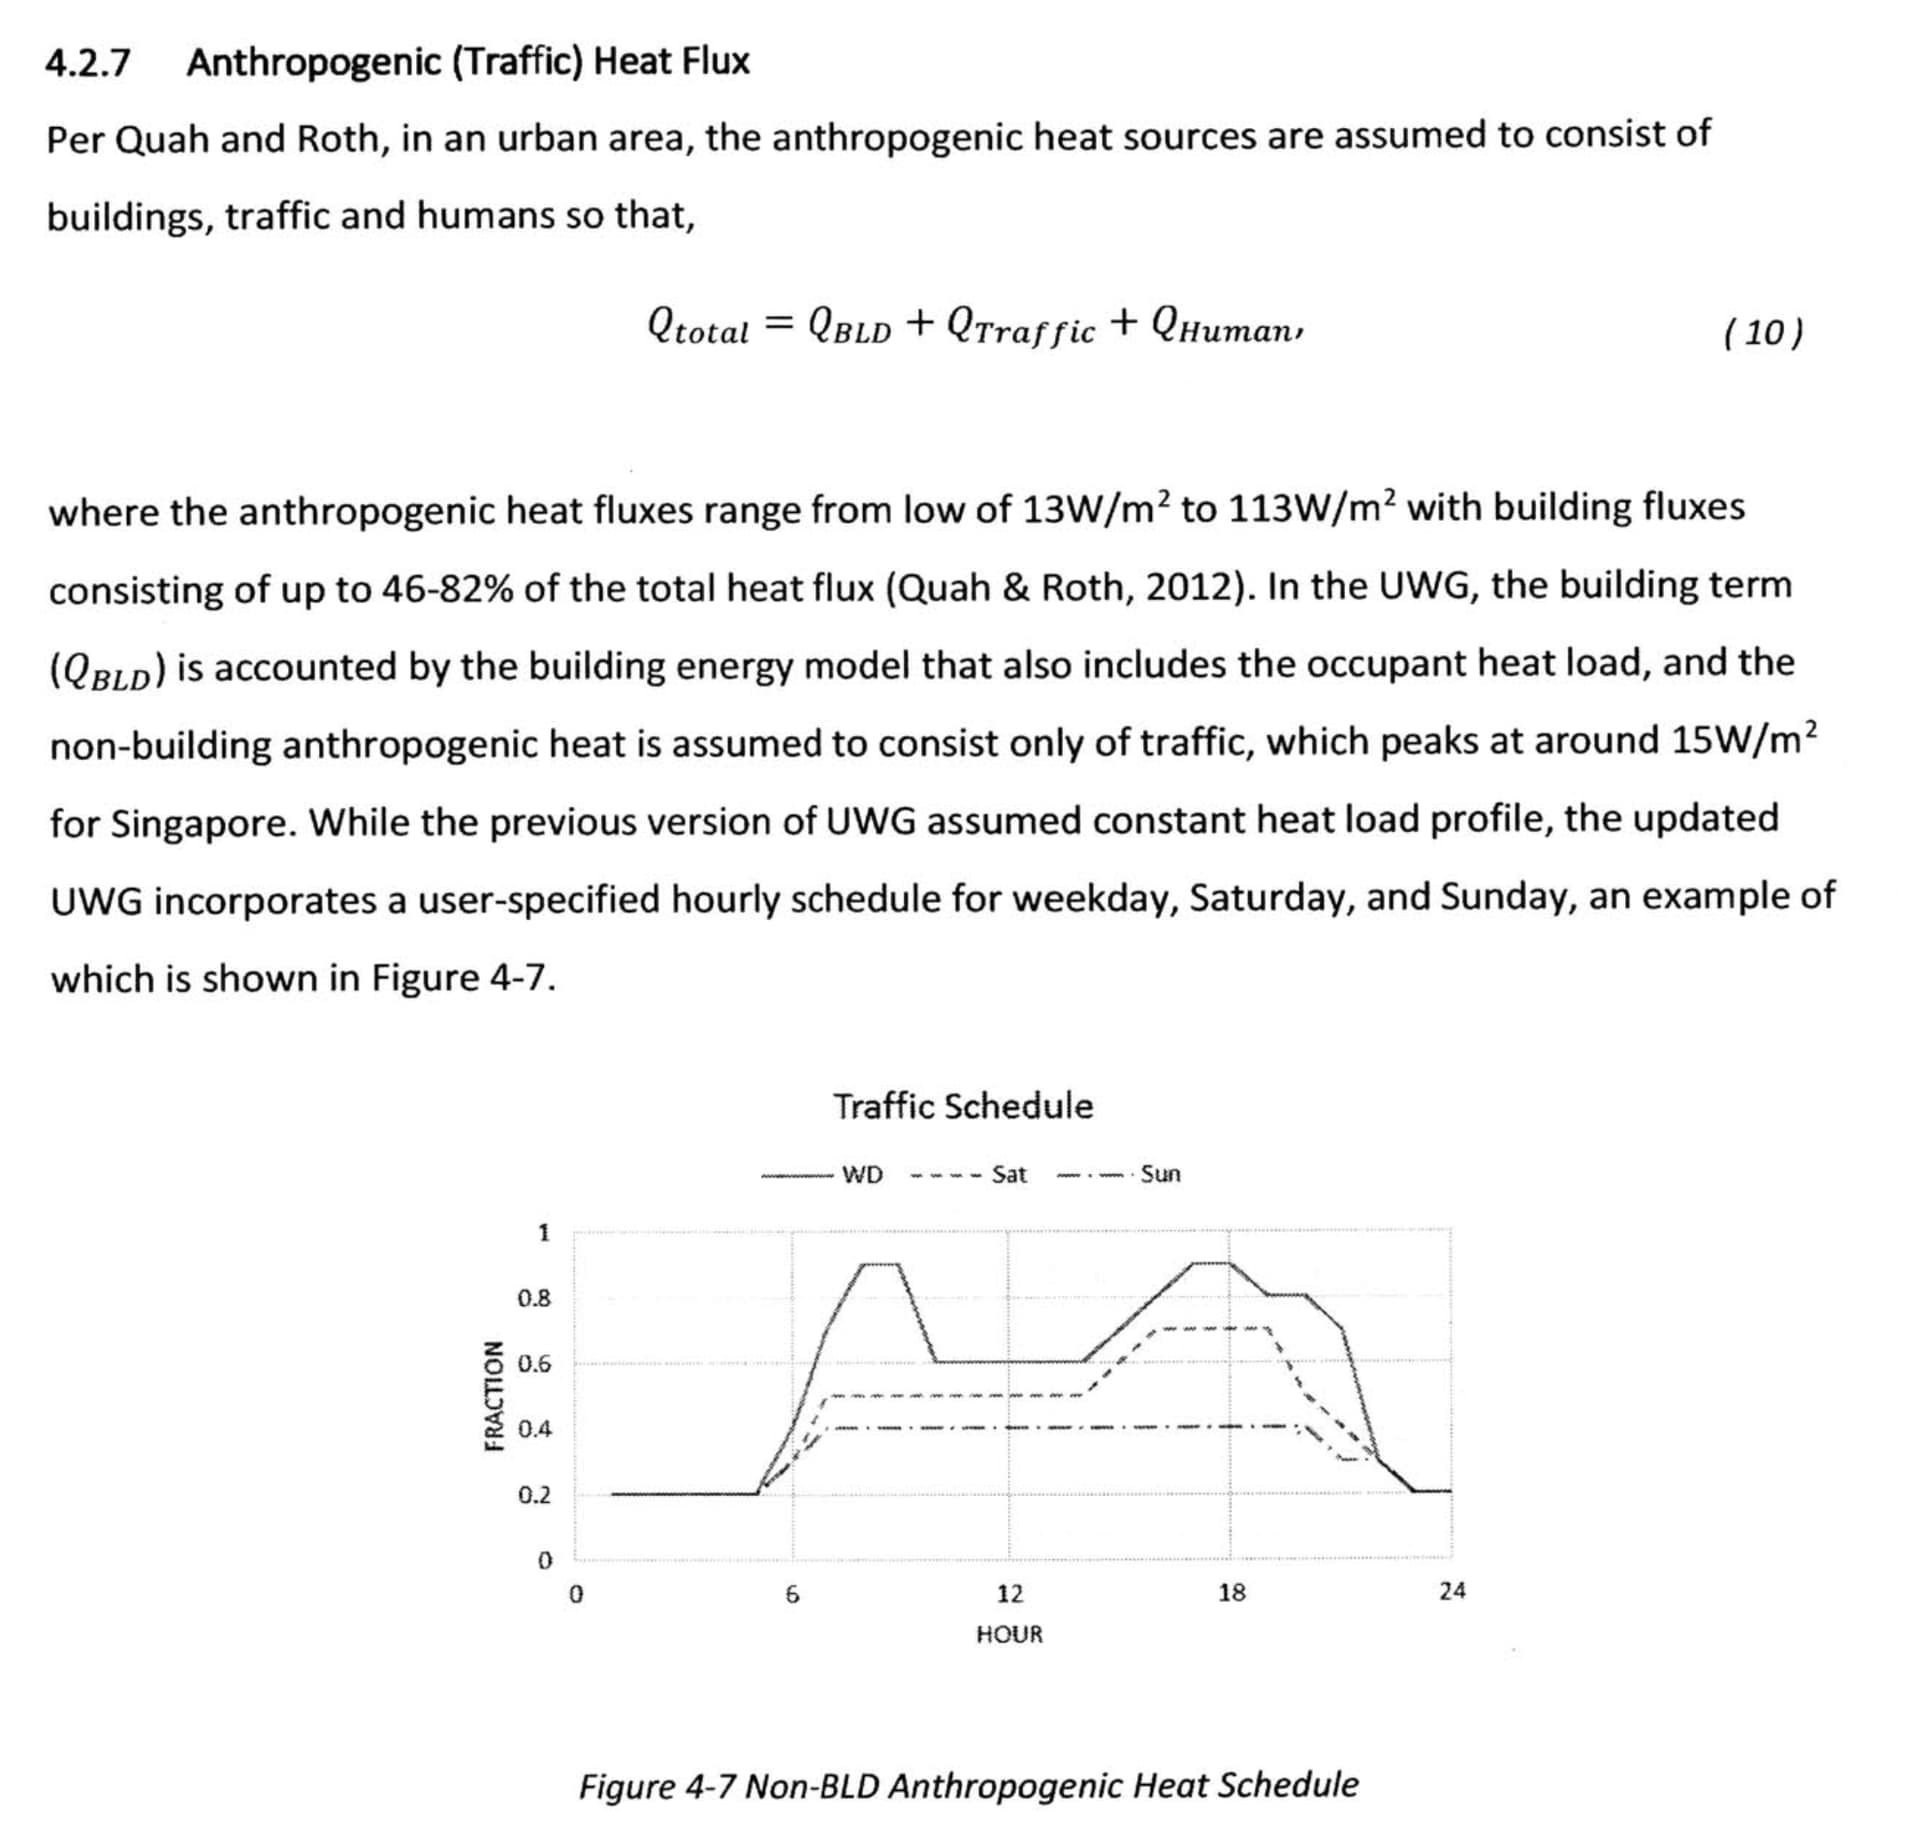
To clarify, this question is of interest, on one hand, because the weekly schedule recommended in e.g. Sailor et al. (2015) from Hallenbeck et al. (1997) is different and only specifies weekday and weekend values (i.e. Saturday and Sunday are not distinguished). On the other hand, the daily sums of the fractions in the current schedule are 13.2, 10.3 and 7.9
for weekday, Saturday and Sunday, respectively. So, I wonder how this relates to the “maximum sensible anthropogenic heat flux of the urban area”, which according to Sailor et al. (2015) should refer to an average day value, calculated from the daily vehicle distance traveled.
Thank you for your answers in advance and all your hard work!
Best regards,
Csilla
Sailor, David J., et al. “Development of a national anthropogenic heating database with an extrapolation for international cities.” Atmospheric Environment 118 (2015): 7-18.
This is definitely a question for either @SaeranVasanthakumar , who did the translation from the original MATLAB UWG to Python, or @josephyang , whose thesis you are citing in your question there.
Hi @Csilla - it’s really been too long so here are just few things I can help with:
Heat coming from traffic is only 1~2% of the solar radiation so in the big scheme of things this is very small to affect UHI in any significant way. If there isn’t any reference in the thesis, I might have also simply derived the schedule based on other similar anthropogenic schedule that I had considered to be reasonable.
The hourly fractions are not meant to be added up. It’s like saying if we define the peak solar radiation at 1000W/m^2, the hourly percentage would range somewhere between 0% to 100% (say 0% at 2am, 30% at 9am, 90% at 1pm, etc.) but if you add this over 24 hours you’ll exceed 100%, which would not make sense.
From what you write, it appears that the current schedule—and, thus, the anthropogenic heat emission calculations—in UWG follow a different logic that that of Sailor et al. The latter adopted an inventory style approach where the hourly, traffic-related anthropogenic heat emission is derived from the average vehicle distance travelled per day—hence, in its hourly de-composition, the fractional values add up to one (see the Hallenbeck et al. method).
The problem is now two fold.
a) First, the values published for different cities by Sailor et al (2005) and Sailor & Hart (2006) refer to the maximum value of all emitted anthropogentic heat fluxes (Q_f,max) and not to the vehicle-emitted component (Q_v, or sensAnth in UWG).
b) Second, due to the methodological differences, the user calculated (daily sum) Q_v values (as per Sailor et al. 2005) are incompatible with the adopted schedule in UWG.
As far as I can tell, the use of either Sailor et al (2005) supplied or derived values with the current schedule can result in the overestimation of Q_v by up to a magnitude.
Best,
Csilla
Sailor, David J., et al. “Development of a national anthropogenic heating database with an extrapolation for international cities.” Atmospheric Environment 118 (2015): 7-18.
Sailor, David J., and Melissa Hart. “5.6 AN anthropogenic heating database for major US cities.” (2006).
Hi @Csilla - thanks for pointing out. I’m not familiar with Sailor’s work but the schedule is meant to be user-adjustable, and you should be able to adopt different definition accordingly.