Hi,
I’m trying to understand the “recommended” workflow when using Dynamic Geometry/Aperture Groups.
By “recommended” i mean implementing a schedule or trigger that will switch from one state to the other. From what i see, it is possible to get data/results for each state individually, but not getting from them how to switch states.
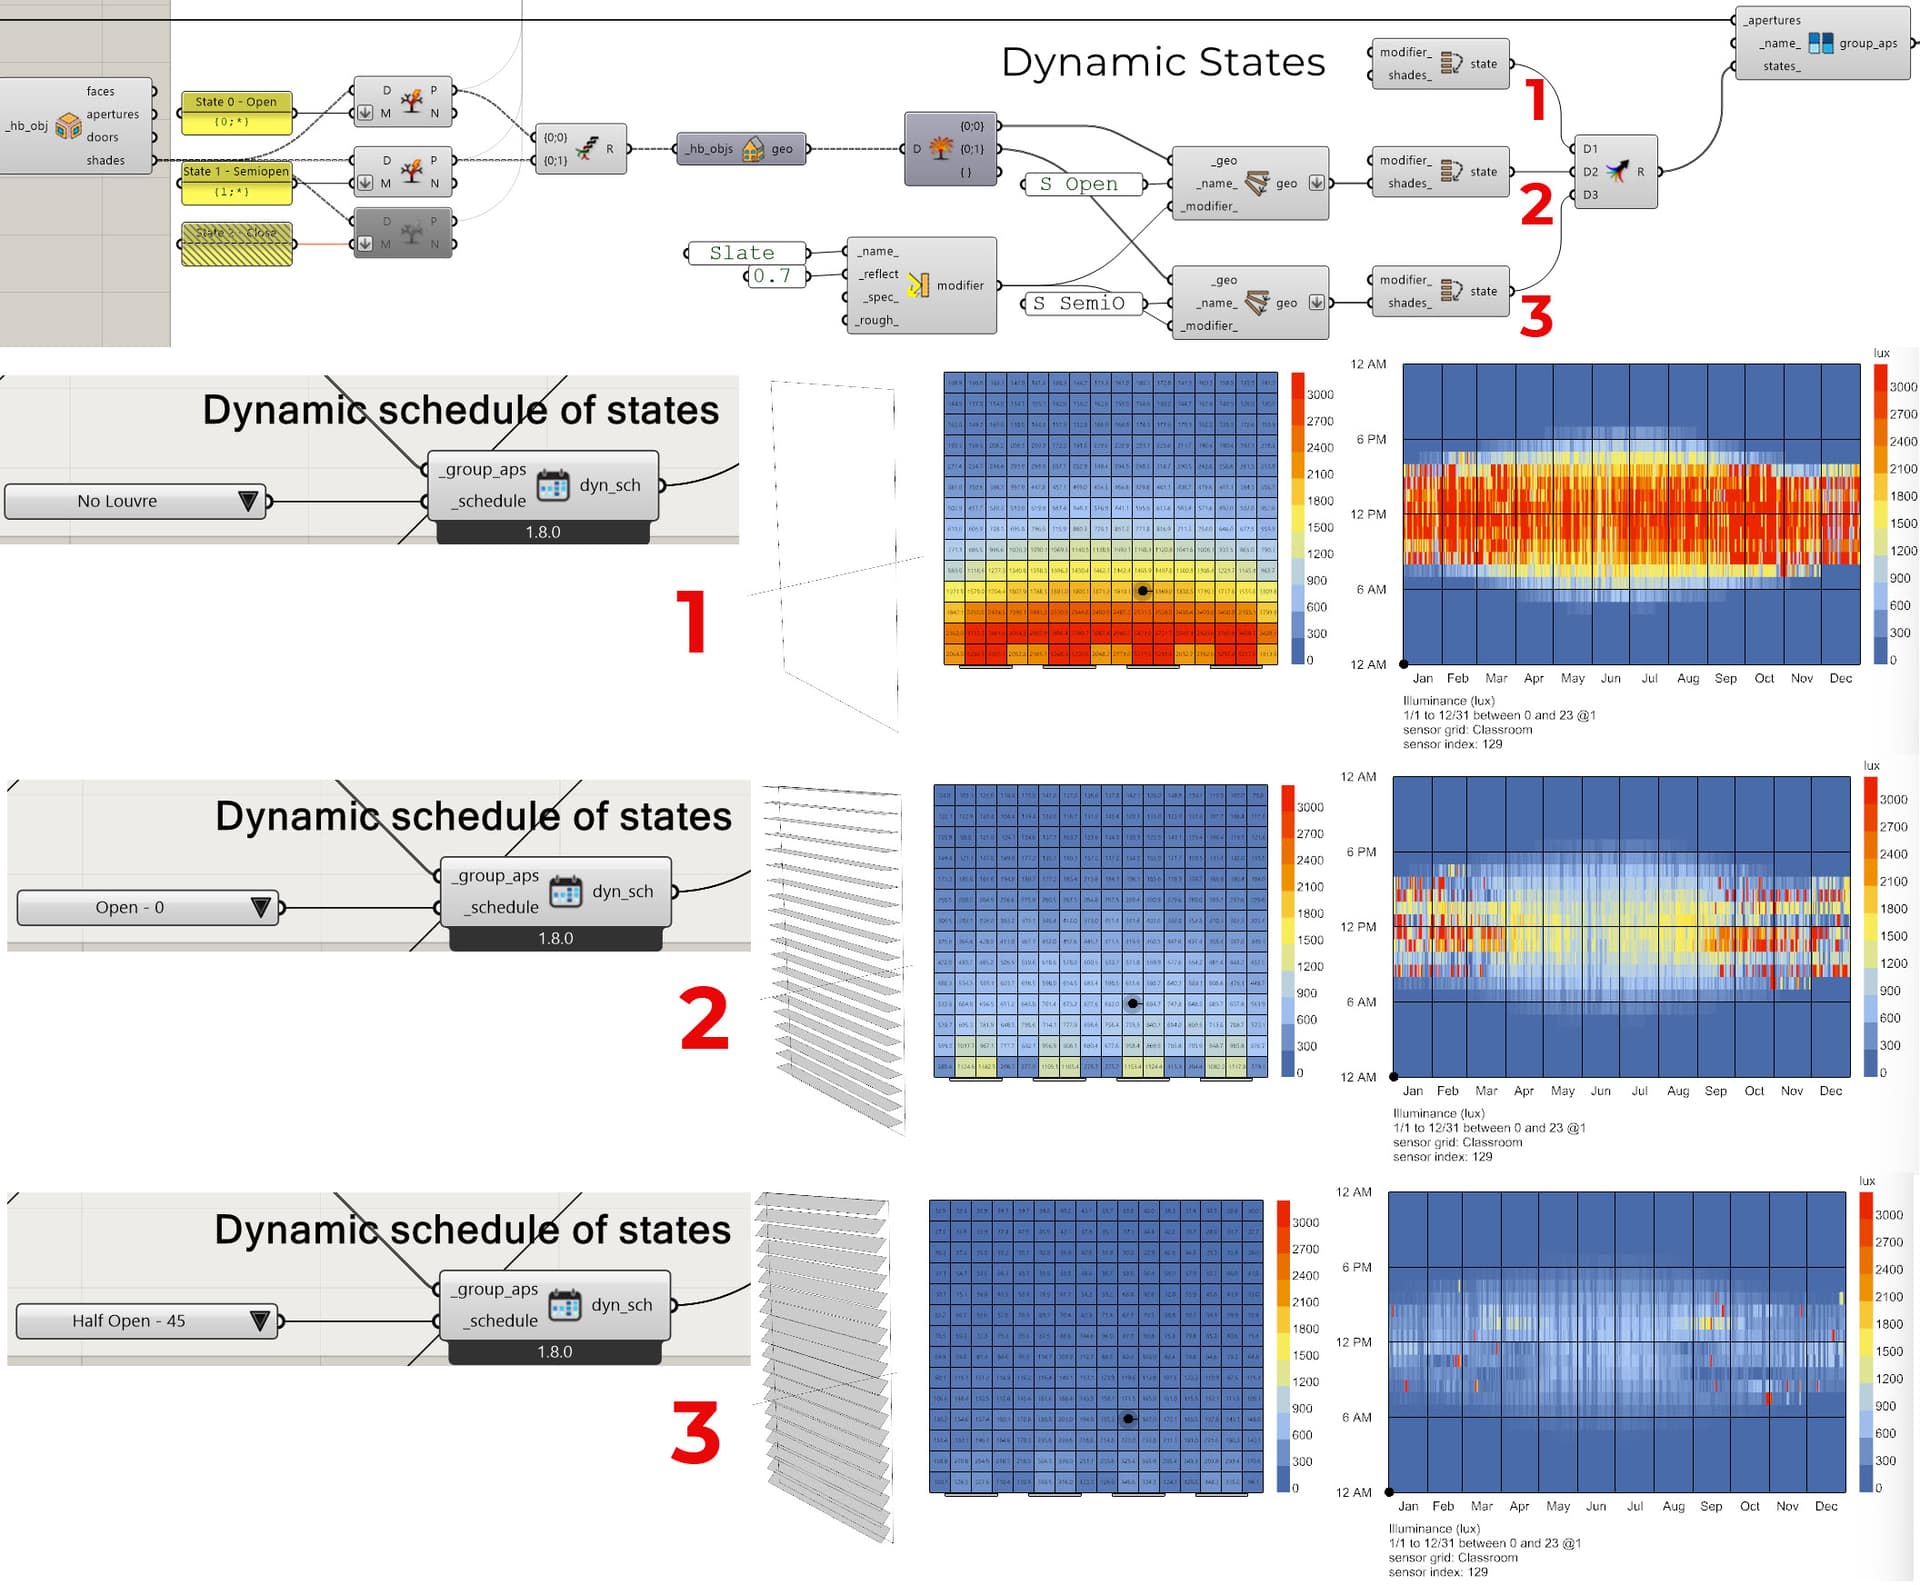
This example defines 3 geometry states: No louvres, horizontal louvres and 45 rotated louvres, like so:
Basically i’m getting 3 alternatives for shading the windows.
My question is if there is a workflow that could create/summarize the schedule for the different states. If there isn’t, what will be the path to take to create one? I’m thinking about taking one of the grid points and get it’s results for each of the states (lux) each hour and accordingly set the state value for each f the 8760 hours (something like @chris suggest in this old thread). Of course, this will be by coding. But i wonder if there is a better approach, computing and accurate wise. @mikkel , if you have wisdom words here i’ll appreciate them
Attached the file I’m working on.
Hi again,
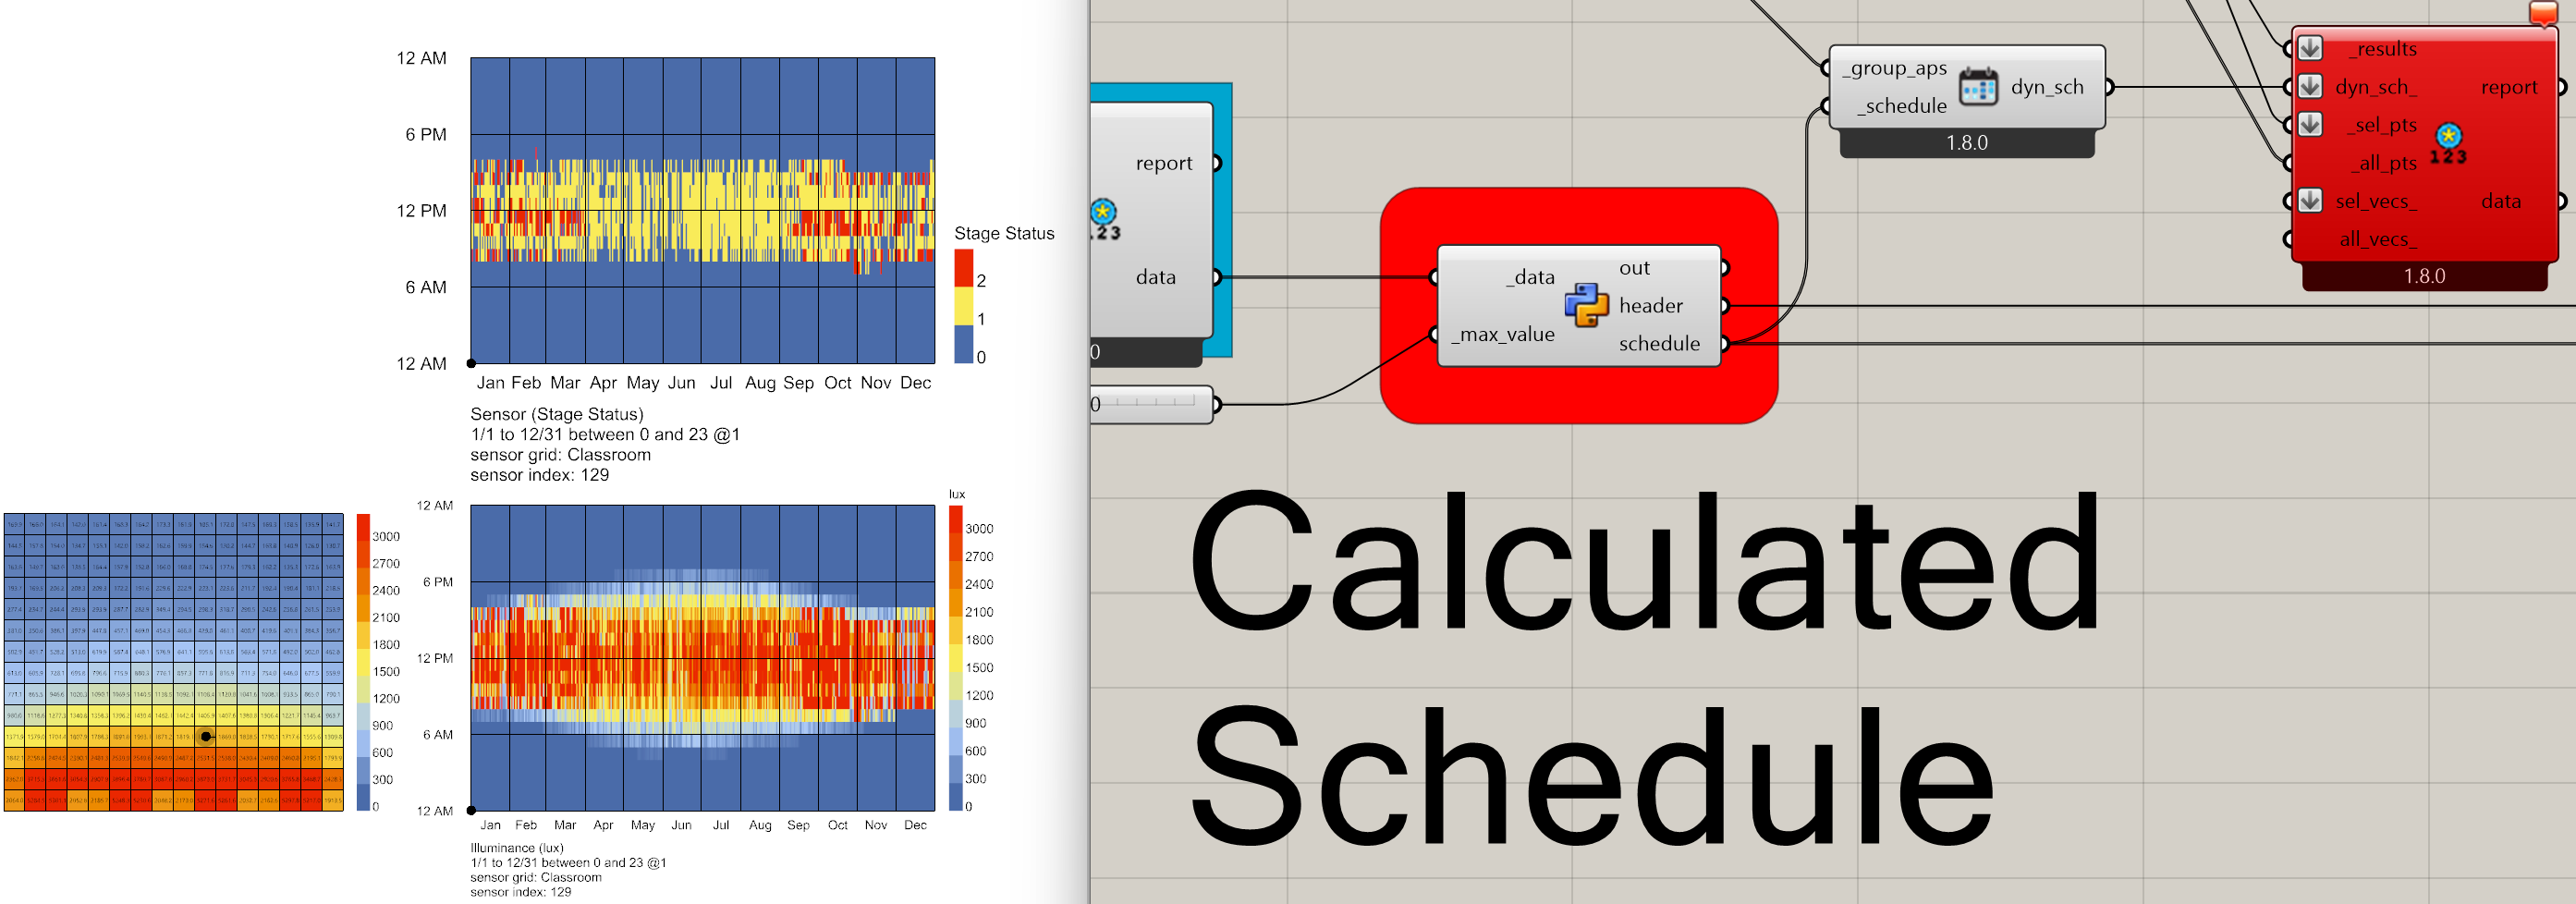
Attached an updated file where i created/calculated a composed schedule (see bottom/right red group.
How can implement it now into the states of the geometry? I guess this is something simple that I’m missing.
Thanks,
-A. Dynamic Geometry for Shades.gh (188.1 KB)
Hi again,
I believe I’ve solved the issue and the workflow.
I’ll appreciate your comments if this makes sense (@chris, @mikkel).
This is the last version of the script, where the average illuminance is plotted in the plan and the annual hourly plot of the illuminance for a selected grid point.
We have talked about adding a method to honeybee-radiance-postprocess that will automatically calculate the dynamic schedule. In that case you fill just input the results folder, select the sensor and the control logic. The output will be the dynamic schedule that you can add to the other post-processing components.
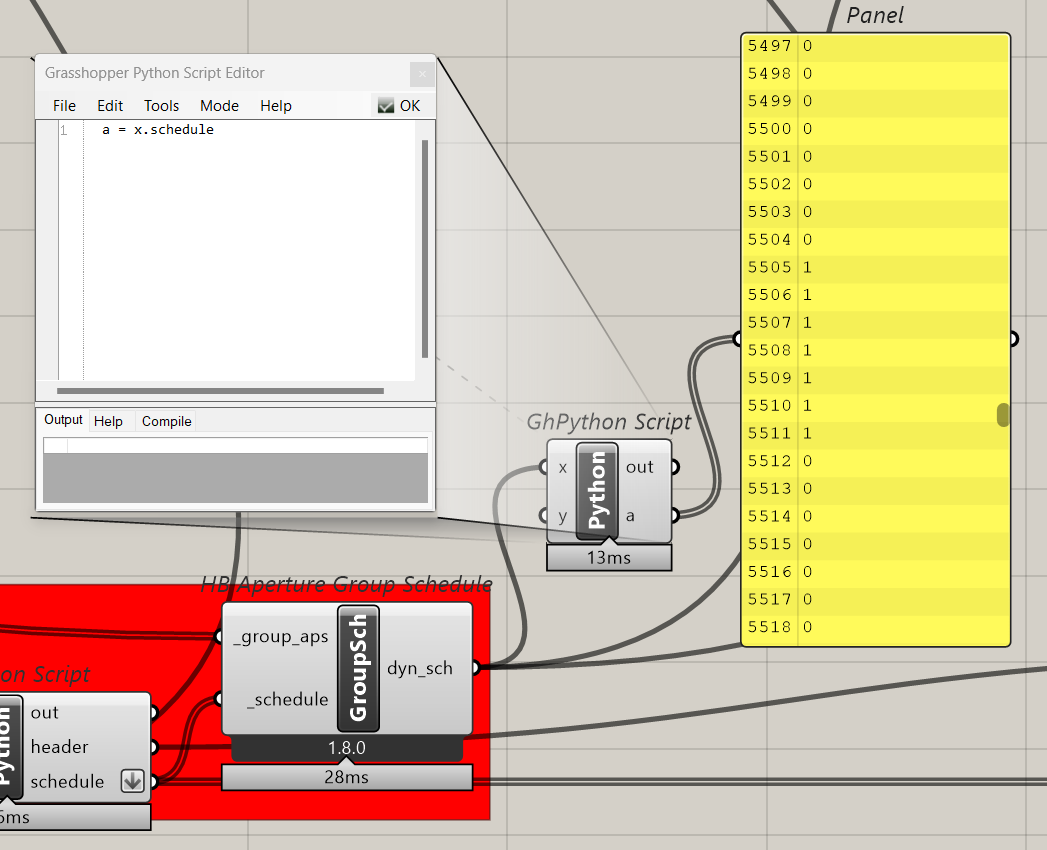
Btw, if you want to see the schedule you can get the values from the schedule, and create a Data Collection and visualize it with a categorized legend.
From this I understand this is not yet available … but will be at some point, right? I think it is important since that will close the circle of the “Dynamic” options.
What is this different than what i did in the script? Just wonder if there is something else …
I agree with you on the last comment. But yes, it will be there at some point.
Ah, I just saw just colors of the plot and thought it was also visualizing illuminance - I didn’t look at the legend! What you did will show exactly the same as what I suggested above.