Hello All,
I got 3 questions which need to answer.
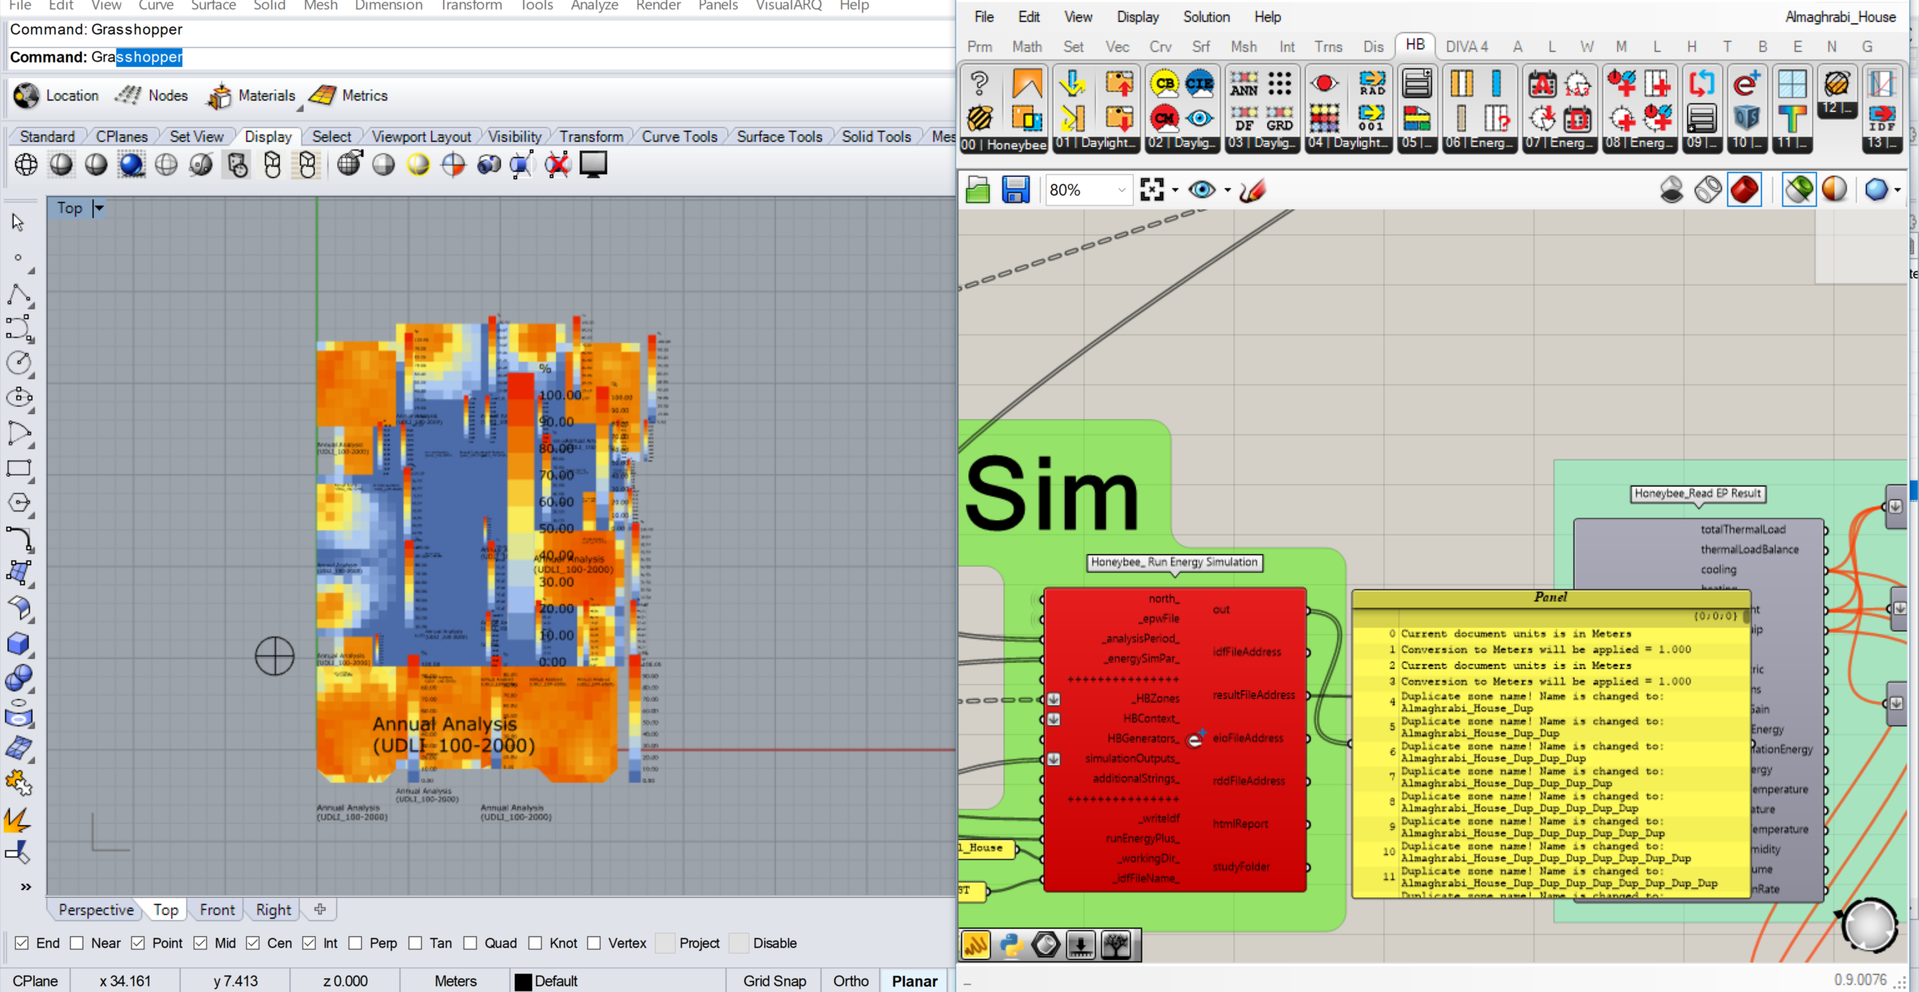
How to make the information away from the plan? and is it able to calculate daylight for each zone individually?
How to resolve the E+ issue?
Almaghrabi_House.gh (818.7 KB)
Thanks in Advance,
Raed
Hello All,
I got 3 questions which need to answer.
How to make the information away from the plan? and is it able to calculate daylight for each zone individually?
How to resolve the E+ issue?
Almaghrabi_House.gh (818.7 KB)
Thanks in Advance,
Raed
Hi Raed,
for your first two questions:
“How to make the information away from the plan?”
I assume you want to remove the text from the plan and only keep the coloured mesh (?). The logic is this: every element (text/surface/mesh etc) that is visible in the Rhino viewport is contained is some VISIBLE component within grasshopper. In the case of the text and the coloured mesh, these are visible due to the reColorMesh component. Toggle off that component and they will disappear. Connect a “mesh” component to the “new mesh” output and you will only visualize the coloured meshes.
“Is it able to calculate daylight for each zone individually?”
Yes, it is already doing that. You have 30 zones, and the results come in a data tree that has 30 branches. Each branch corresponds to one zone. By the way, i see you do a mass addition on the UDI values. That means you are adding the percentages of all points in a zone, which makes no sense. Better do an average of each zone.
Thanks @IasonBournas for help!
It’s resolved! But, I’m still stuck to resolve the text. I’m looking to add only one legend beside the mesh or plan on Rhino canvas.
Also, I got this as well! Thanks again!
Good to know! thanks one more time!
@IasonBournas I’m not sure if you have an answer for my third question, don’t you?
This is a real building and I need to validate it. To make the simulation result close to real life by comparing the electricity bill and the simulation result from E+ component. So, do you have any idea how to resolve the issue, or any video link could help?
Thanks,
Raed
Same as the results that come in a data tree (30 branches), the legends (coming out from the “newLegend” output of the “reColorMesh” component) are also in 30 braches, one legend per zone. All these legends are the same. So you need to visualize only one of them. See attached script Almaghrabi_House_1legend.gh (820.5 KB) on how. To get a deeper understanding, you would need to learn about grasshopper data structures, such as trees/branches/lists, and operations on those, such as flattening/grafting etc. Some info here and here.
I am afraid i am not the best to answer your third question. You can try re-posting it. It is always good practice to read the error log and to search online specifically for each one of the errors you encountered.
Have a look to the attached GH file. It should work now. Make sure to update the components. Thanks,
Almaghrabi_House (1).gh (770.0 KB)