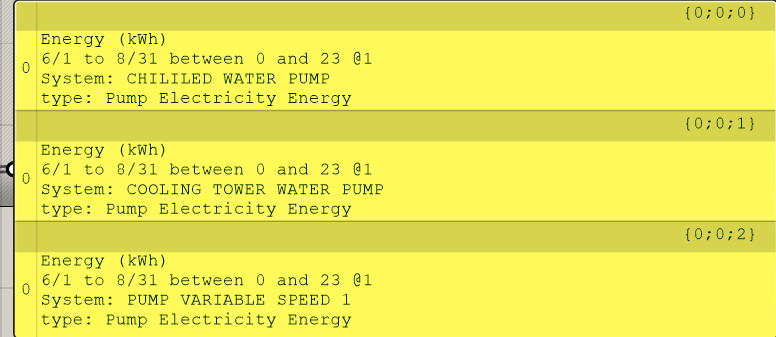
When I was processing the energy consumption results calculated by Honeybee, I found that the legend for the energy consumption of pumps (cooling water, chilled water, etc.) in different systems was “Pump Electricity Energy” in LB monthly chart. This confused me because I needed the energy of individual systems. Then I realized that the legend identified the “type” label in the data, but what I actually needed was the content of the “system” label. Is there a more convenient way to do this?

Hi @Jimmy_Ye ,
Sorry for the late response here. You are correct that the monthly chart labels the data with its type by default. This is usually what you want when you plot things like heating and cooling on the same chart. Or you are plotting things like dry bulb temperature and dewpoint temperature from the EPW. Normally, if I were to plot pump energy use like this, I would sum all 3 of these data collections together with LB Mass Arithmetic Operation component and look at them as a single data collection in relation to other things fans, heating, cooling, etc.
For this type of case where you want them to be labeled with the System key, you can do this with 3 lines of Python inside a single GHPython component. Here is a sample:
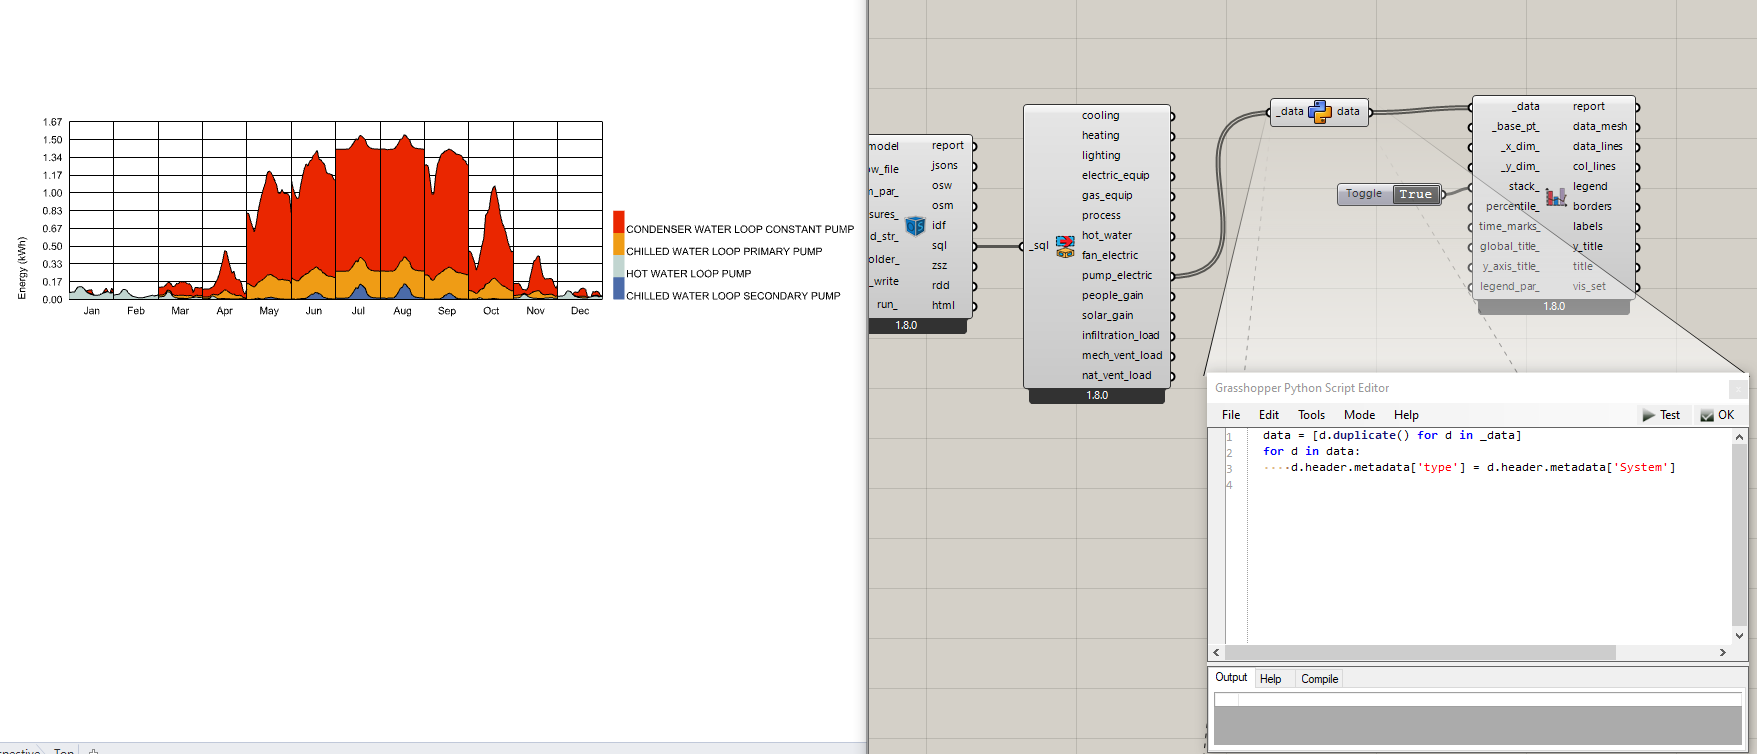
sample_of_changing_data_type.gh (63.7 KB)
Hope that helps!
Thank you so much,Chris.
This is very useful!