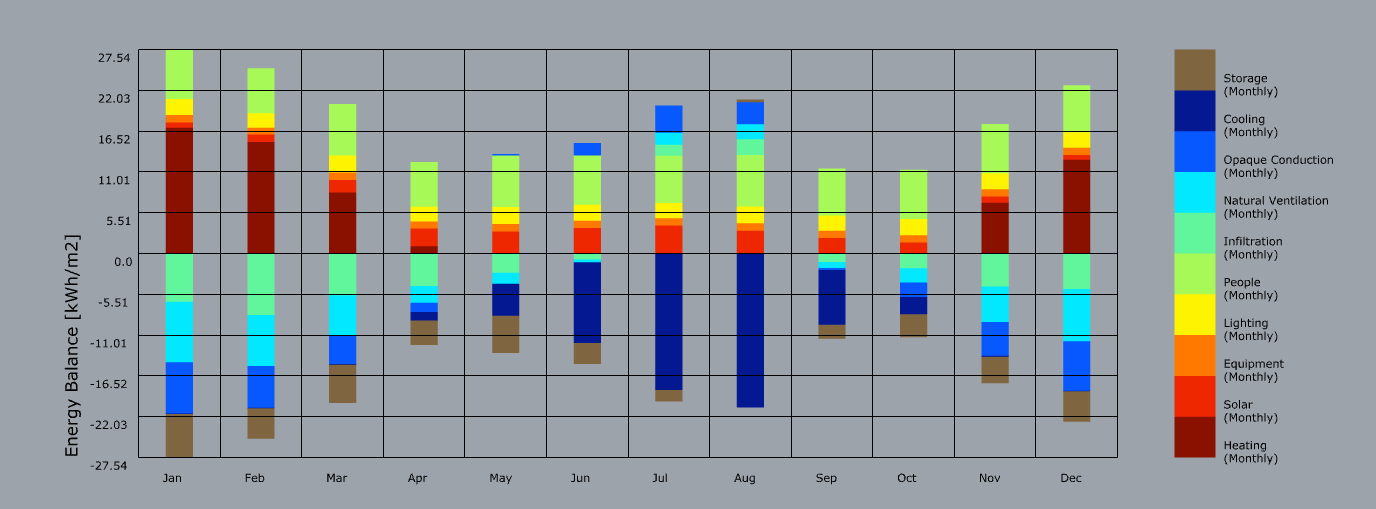
I’m trying to visualize the EnergyBalanceChart of an energy simulation for a large building (81 thermal zones), but I’m having trouble visualizing the Glazing Conduction contribution to the balance.
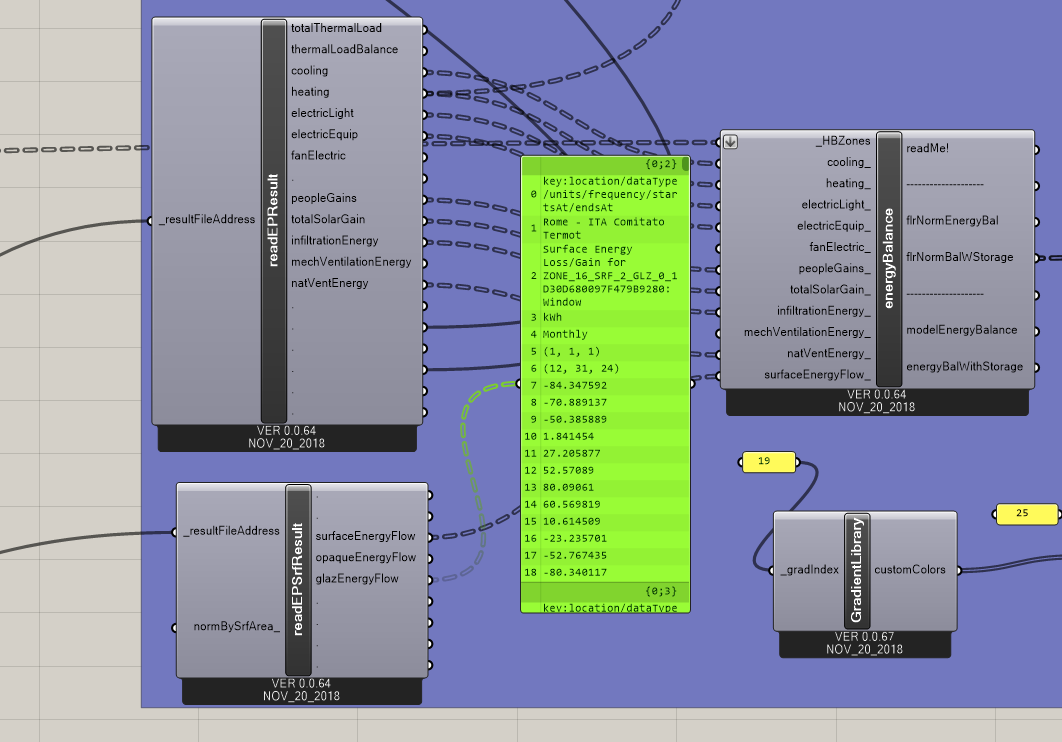
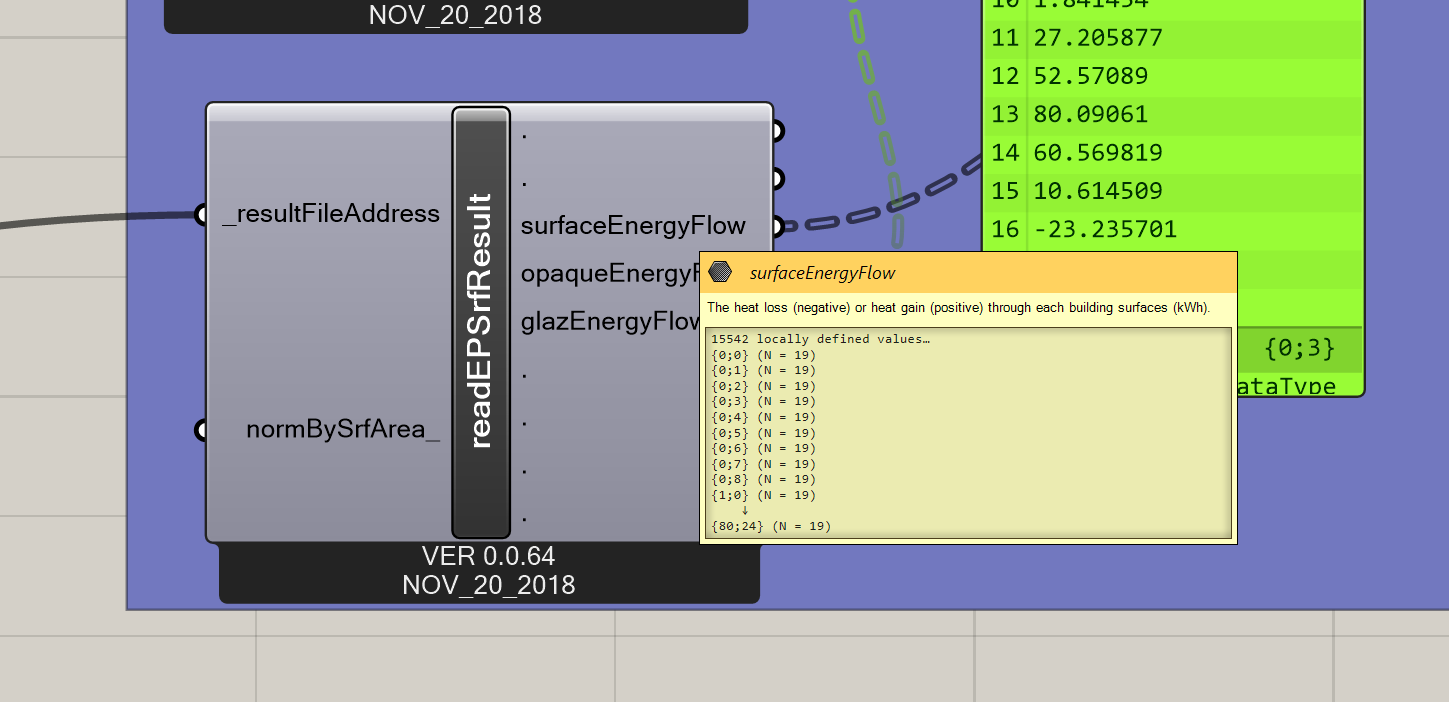
Everything seems to be working properly, indeed readEPSrfResults does correctly output both opaque and glazing surface energy flows, as you can see from the attached picture.
Do you have any clue why this is happening? I guess probably the number of values (15542) is too large, could it be?!
Hi Michael,
I am sorry I completely forgot about this post.
I figured out that the reason why glazing surfaces weren’t considered in the energy balance was that their names on the result file didn’t match with the ones in Honeybee (HB), which are generated randomly at each Rhino startup.
I used HB to generate the IDF file, which was then modified manually in the IDF editor and then loaded again in HB for visualization. However, while simulating, I used to close Rhino and as a result, when opened again, the names of the glazed surfaces changed.
My solution was to copy&paste glazed surfaces from the IDF generated by HB to the manually modified IDF and launching the simulation from Rhino.
I believe a more elegant solution would be createHBSrfs, assign a name to each surface (both opaque and glazed) and then createHBZones. This should avoid the problem, but I haven’t tested it yet.
I guess this workflow is time consuming at the beginning, but simplify the “debugging” later on. I would appreciate feedback on that, I am a novice in HB and I am unsure which is the best workflow.