I would like to share with you a post-processing method I developed to visualize EnergyPlus simulation output data in SQLite databas file format in the Tableau software to facilitate data analysis related to building energy performance evaluation in different spatial and temporal scales.
It is documented as a Gitbook in this link.
To use the workflow as introduced:
- download the example files shared in this link.
- go to Appendix I to install SQLite ODBC driver for Windows.
- In Tableau Desktop, open the Tableau workbook as shared.
- connect to the SQLite database generated from EnergyPlus simulation.
- refresh the pre-customized dashboards in Tableau.
It is still a work-in-progress document, so the contents will be updated later. You are welcome to try out, and your suggestions are also welcome.
Hope this can help to increase the efficiency of building energy performance simulation and evaluation, and looking forward to seeing your own customized dashboards.
Ji
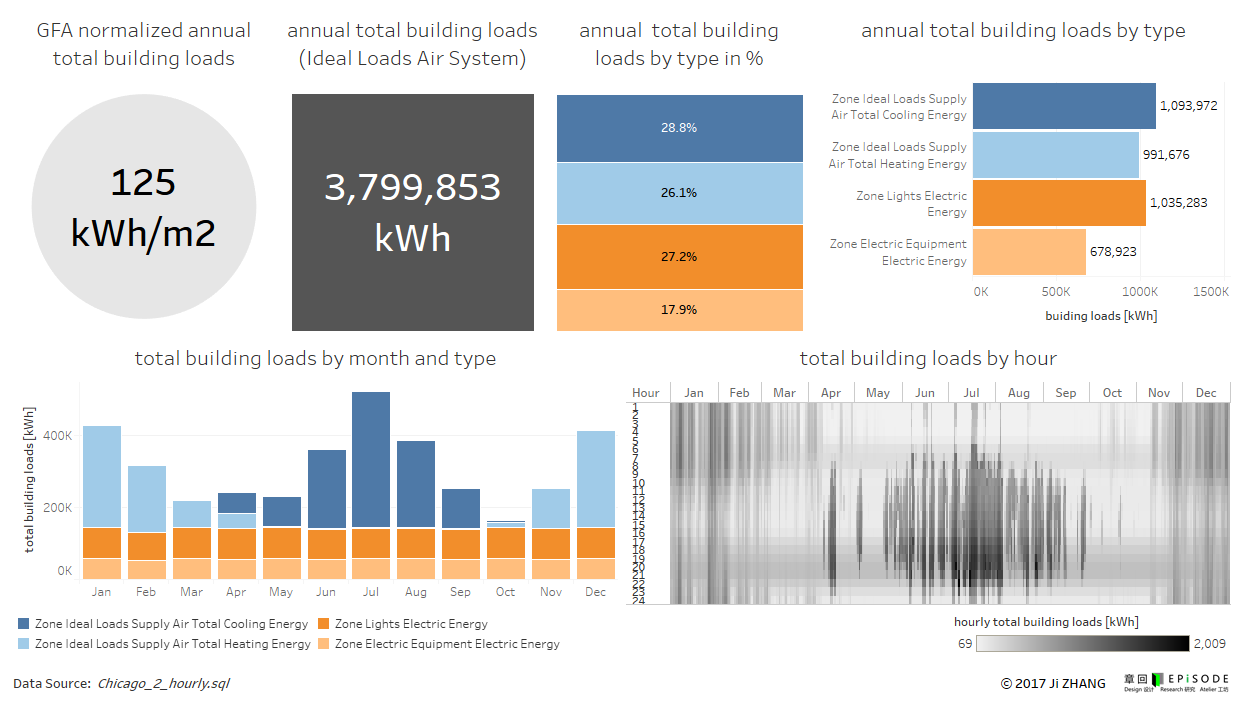
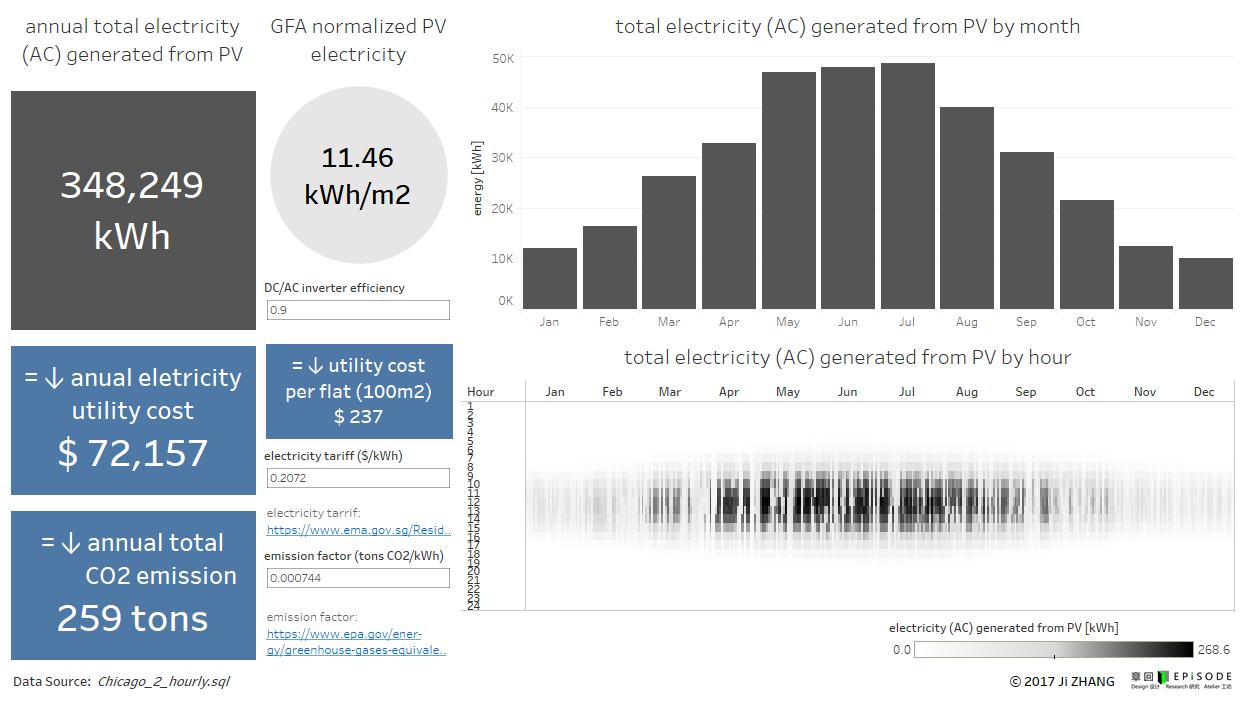
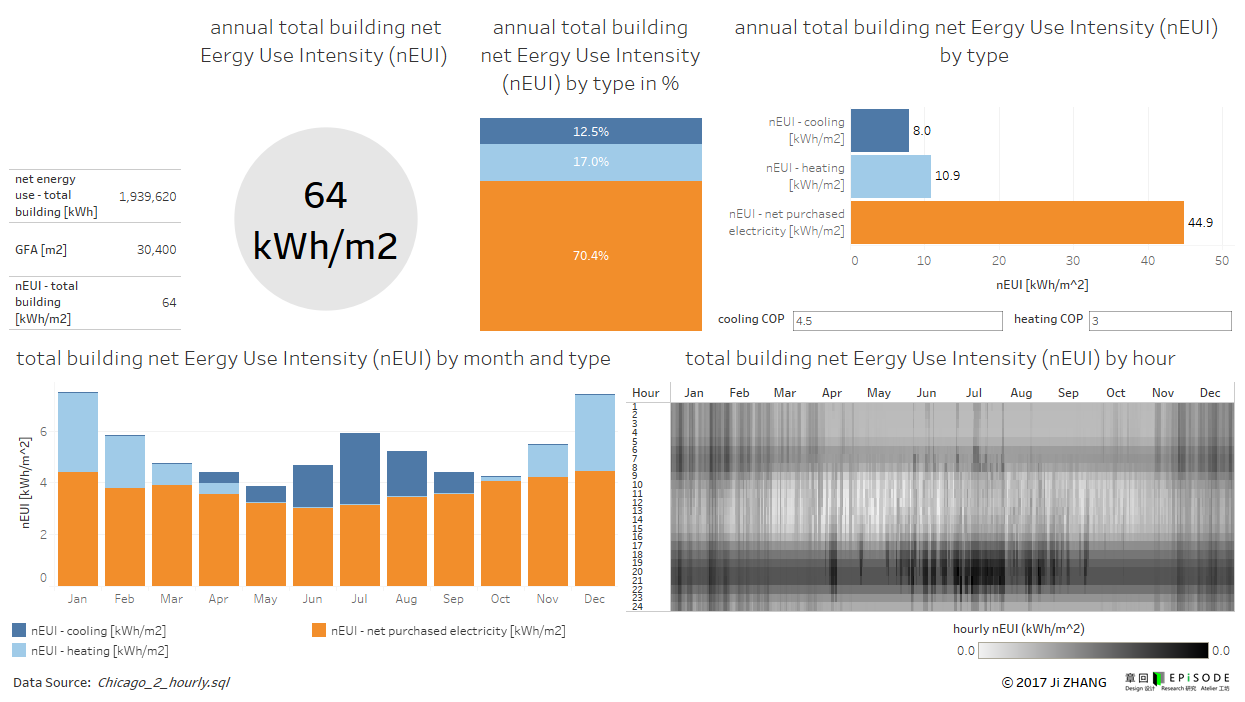
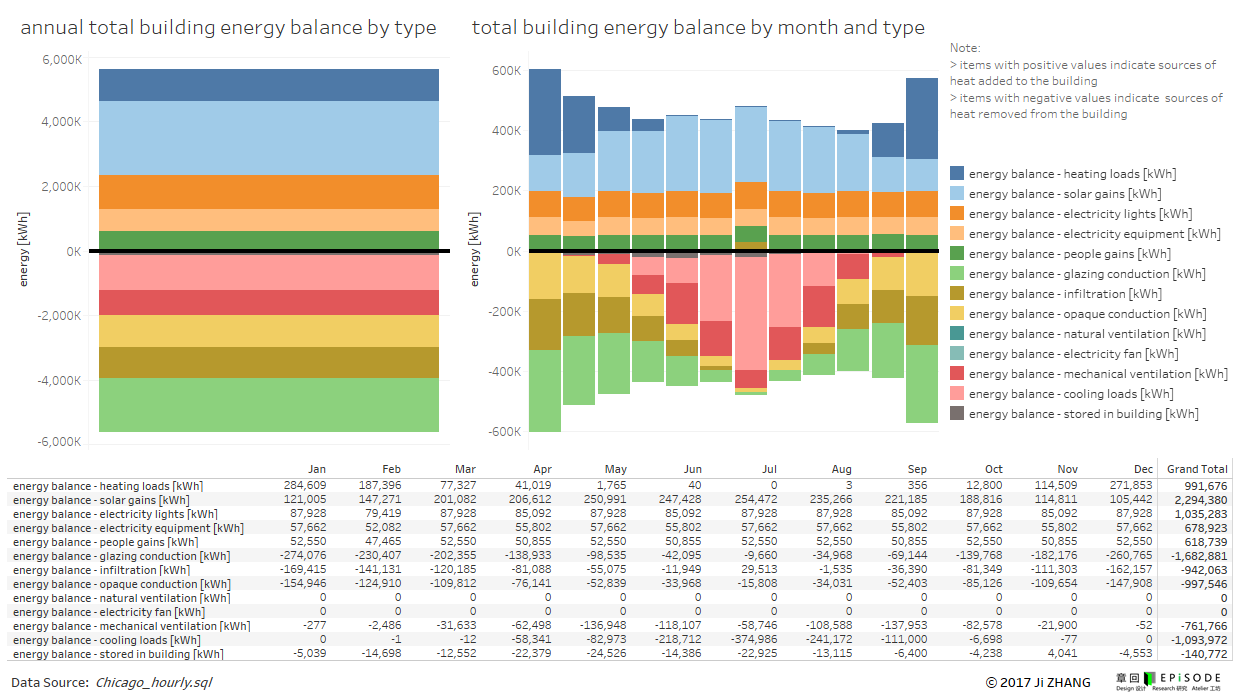
Here are some of the dashboards as provided:
8 Likes
Thanks @Grasshope for sharing. I’ll definitely will try … soon.
-A.
Thank you for sharing, @Grasshope. It looks amazing. I will try it soon !
Awesome, this looks so helpful. I’ve always been frustrated with having to throw E+ outputs into excel, and even the native OpenStudio viewers are a bit restrictive when you just want to check out the raw data. I can’t wait to try this out.
Thank you so much for sharing this smart workflow.
Just one question about workflow:
How it is possible to generate my custom database (from my test geometry)? There is a pre-set GH definition (with HB+LB) from which generates the personal sql file with all your records?
Thank you in advance (for my beginner’s questions).
Great !. This workflow is amazing nice. I have been tired to filter the simulation result and copy it to excel for visualization. Your workflow is just what I dreamed to do especially for the energy balance. Many Thanks!!!
Hi, @Ambrosinus, the Tableau workbook file as shared read from only the .sql file generated from EnergyPlus simulation. The IDF and HB object files are not required.
Check this link:
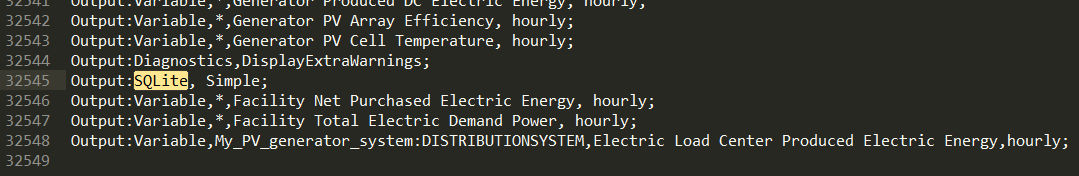
For EnergyPlus to generate the .sql file (the SQLite database), you only need to put the following line of text in your IDF file:
Output:SQLite, Simple;
… like this:
Hope this answers your question.
1 Like
Thanks, @minggangyin.
Please take note of the limitations of the energy balance chart in this workflow as stated here:
I haven’t figure out how to filter the data by surface type because the “surface” table in the SQLite database is not joined in this workflow. So, the opaque conduction item is the one considering all opaque surfaces, including both exterior and interior ones (walls+floors+ceilings+roofs). This is not what is defined and calculated by the Honeybee construct energy balance component which correctly considers only the exterior opaque surfaces.
@Grasshope Thanks for your tips.I will compare the energy balance between your workflow with Honeybee definition.