Hi,
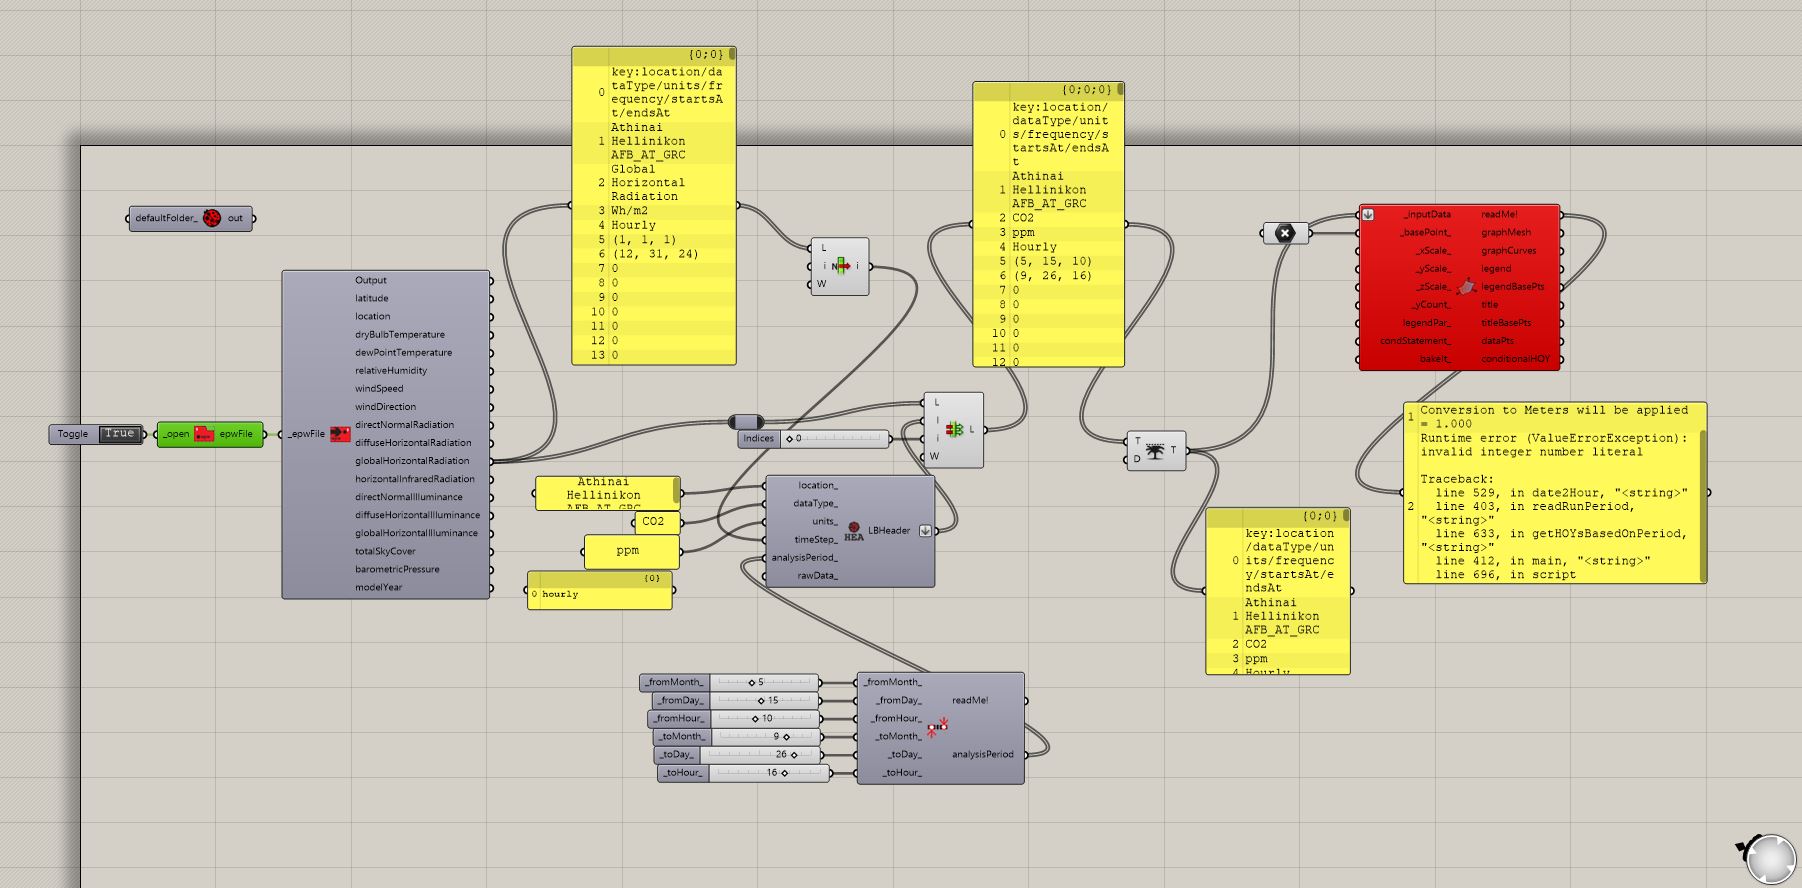
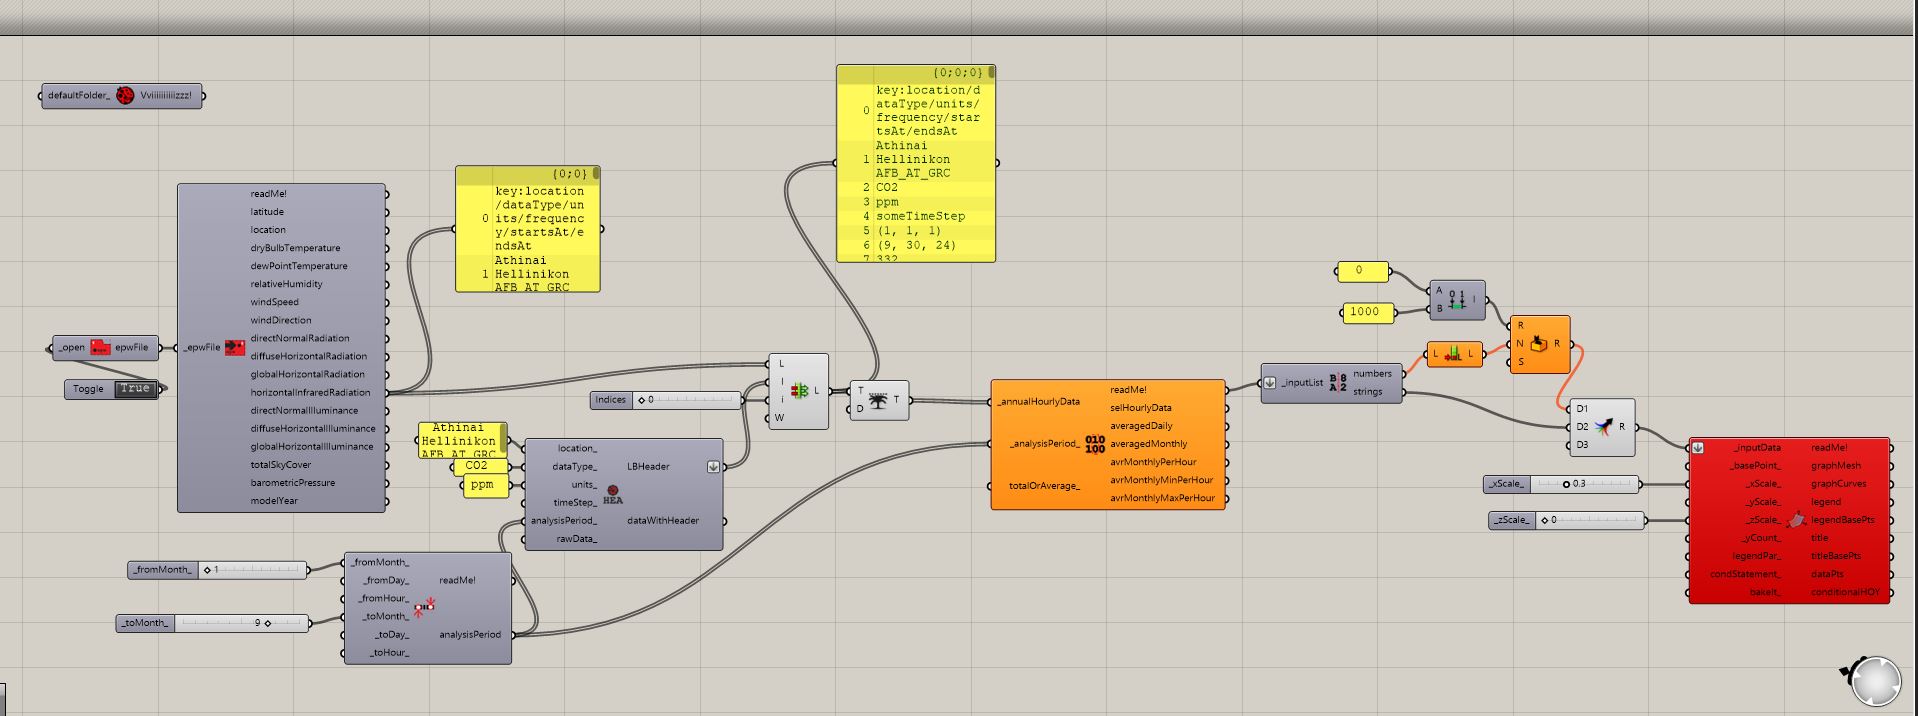
I’m a university student, currently getting into parametric architecture. During the current semester, I wanted to visualize and analyse the carbon footprint of the Piraeus Tower using the ladybug plugin. I followed both the attempts of this link (EPW file customization to visualize CO2 concentration in a 3D chart - Grasshopper), from the grasshopper forum. There is an error with the “3D chart” component in the first attempt, as for the second one same goes with the “3d chart” component but also with the “average ladybug data” component.
Is it possible to visualise carbon footprint on a building using ladybug or any other plugins on grasshopper?
Thanks in advance