I tried to use iterator of TT Toolbox to run a few simulations and export the result of each simulation to excel. However, all the excel files contain the same set of results (the result of the final simulation overwrote the other results).
Is there any solution to avoid the overwriting of results?
I will check this and this in the hydra site.
Also recommend using the GH data recorder, which allows you recording the results of each iteration which then you can write to excel with TT Toolbox (this is the option i use).
-A.
Hi @AbrahamYezioro, it’s me again
I’m using GH data recorder and write to excel from TT toolbox to record hourly data of my iterations, since colibri list of values is limited to 10 only. My simulation period is from May to September and hence I have 3672 hours.
My question is: is there a way to separate the data that are being recorded in excel per iteration? for example, at the moment I get one column with 14688 values representing 4 iterations (since one iteration has 3672 values), wondering if I can get them recorded separately so it saves post-processing time.
I’m not sure i understand your problem. If you can describe/show a real example of what you are trying to achieve it will be helpful (for me).
FYI, though i use TT i’m more using Colibri. I’m not aware of limitations like the one you describe. I can define as many columns as i need.
For your case i’m not sure you need more than 2 columns: One for the date and one for the simulation result. But maybe i’m wrong since i didn’t understand well.
-A.
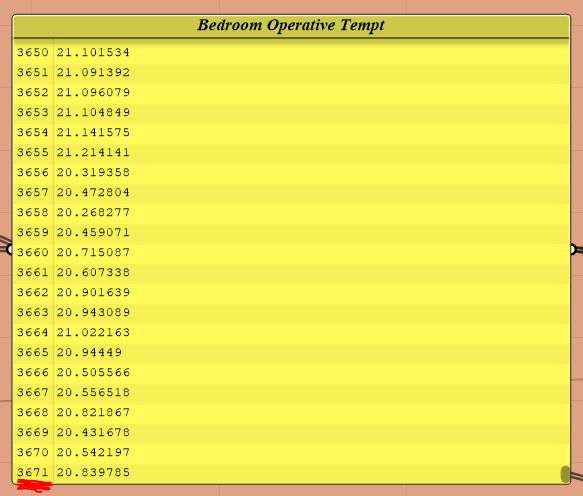
ok let me try to explain this more clearly. I’m running a simulation from May to September and I need to record data on an hourly basis for each iteration, so below is an example list of output (3672 values)
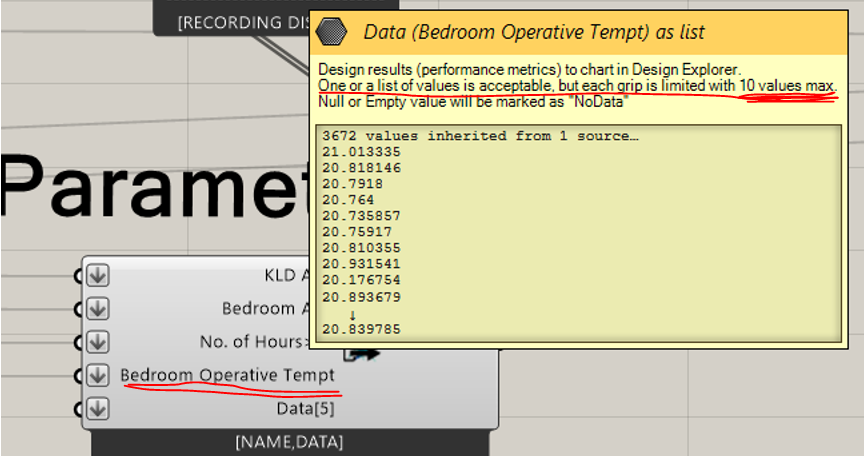
If I connect the above output to Colibri Parameters component I only get the first 10 values of the list recorded as shown below.
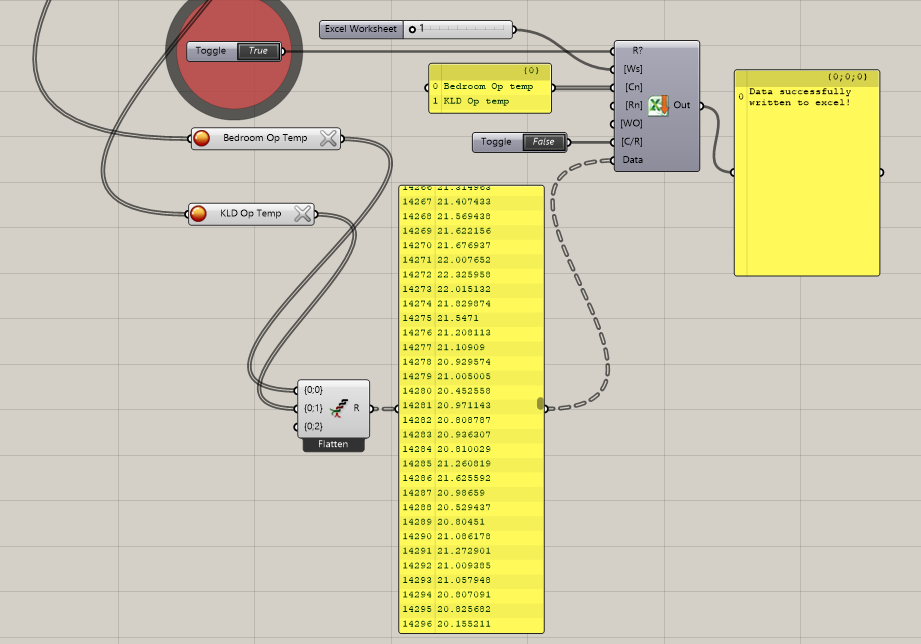
So I tried recording the data with GH recorder and writing to Excel as shown in the little script below (the variables are still automated by Colibri Iterator)
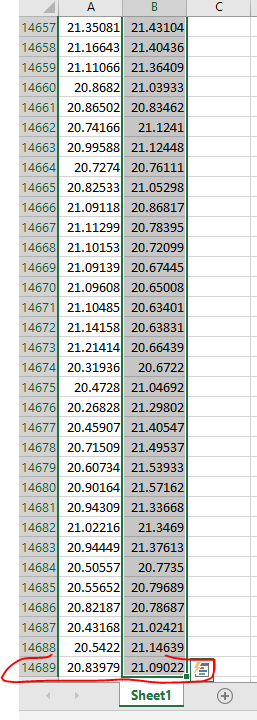
But the issue is that I can’t easily tell where each iteration results start and end, as the data is being recorded for all iterations in one column in excel as shown in the image below. I mean I know I have 3672 hours for each iteration, so I can try and separate that manually in excel but given that I will be running around 7000 iterations, I’m looking for a more reasonable way of doing it. I thought of trying to iterate the sheets of excel through a slider so that each iteration is written in a sheet, not too sure how to link that to Colibri so that they are running in parallel.
So you mean that each alternative is giving 3672 results? If so, just want to warn you to expect memory problems!!! The data recorder will get very heavy. Unfortunately you can’t set it on/off automatically, so for each iteration you can write and empty the results.
I came up with two options, hoping one of them fits for you. See attached. I thing the bottom one is the one, but not sure.
Good luck.
-A. Export2Excel_TT.gh (15.9 KB)
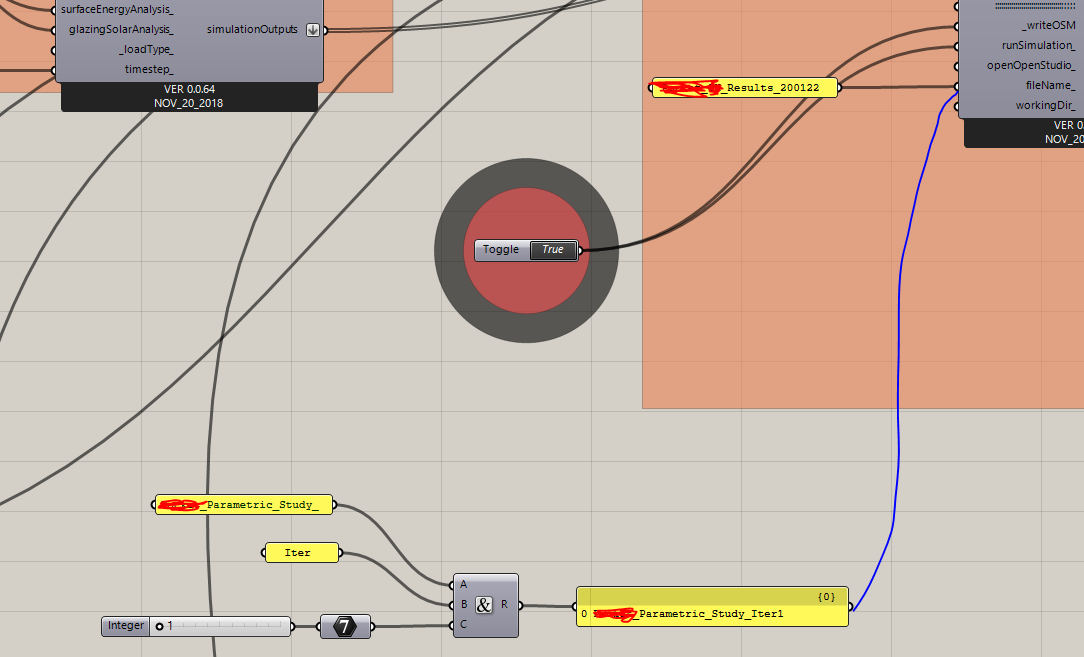
Thanks a lot for your help @AbrahamYezioro. I will check these and see which works best. I’m a bit worried about memory now. Would it be faster and less memory consuming if I change the idf file name iteratively? so that I get an idf file for each iteration and that should have the results I need. I was trying something like the image below but wasn’t sure how to link that to colibri so that slider with file name corresponds to the combination of design elements in colibri iterator. any ideas?
Not sure what to suggest. i need to try myself, and i don’t have the time right now. Just be sure your are in control of the process before you run the 7000 alternatives.
-A.