Thanks for your reply @AbrahamYezioro
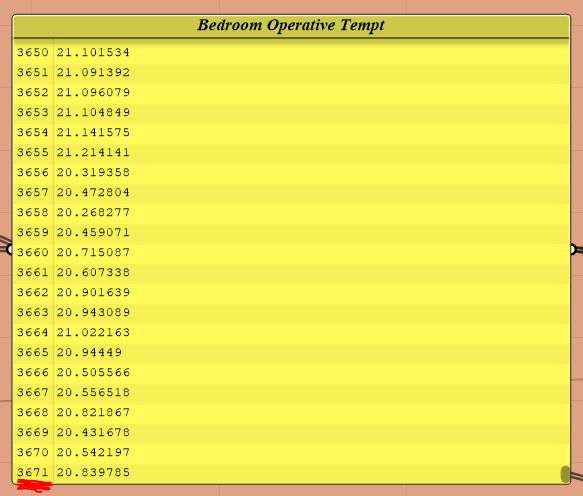
ok let me try to explain this more clearly. I’m running a simulation from May to September and I need to record data on an hourly basis for each iteration, so below is an example list of output (3672 values)
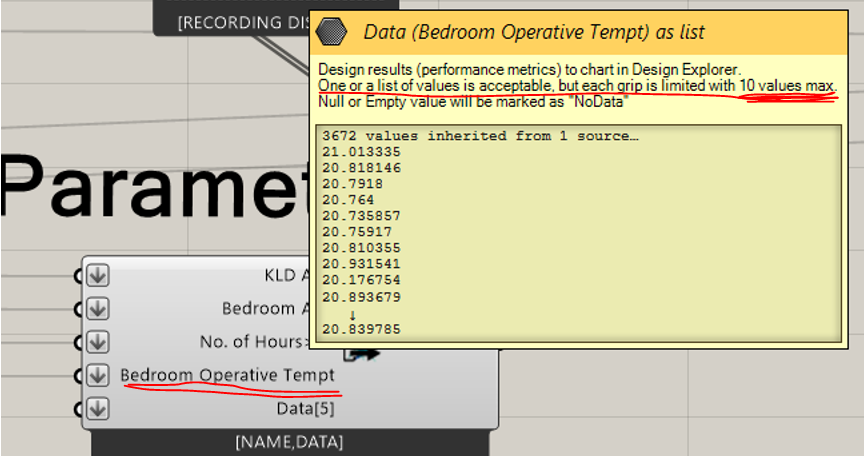
If I connect the above output to Colibri Parameters component I only get the first 10 values of the list recorded as shown below.
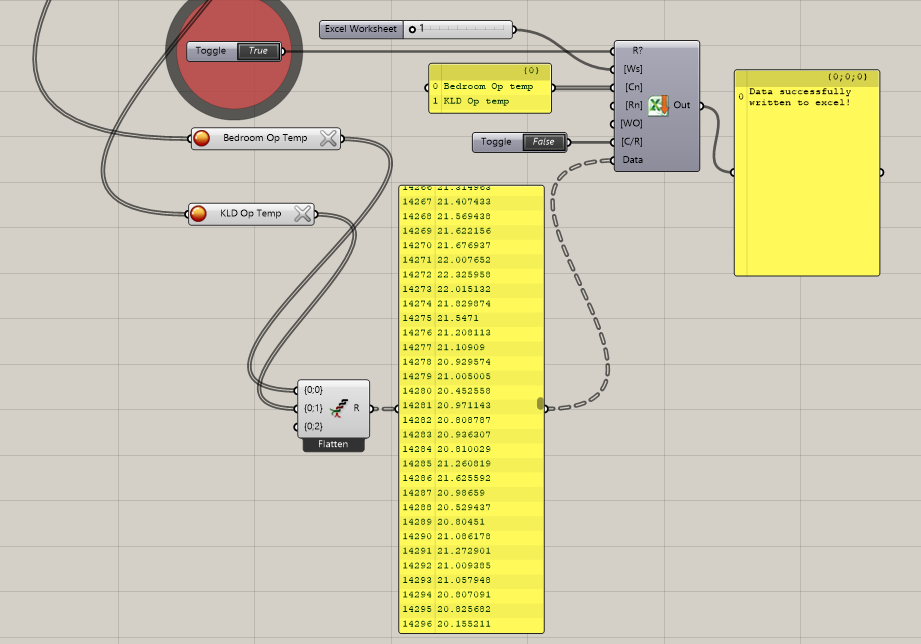
So I tried recording the data with GH recorder and writing to Excel as shown in the little script below (the variables are still automated by Colibri Iterator)
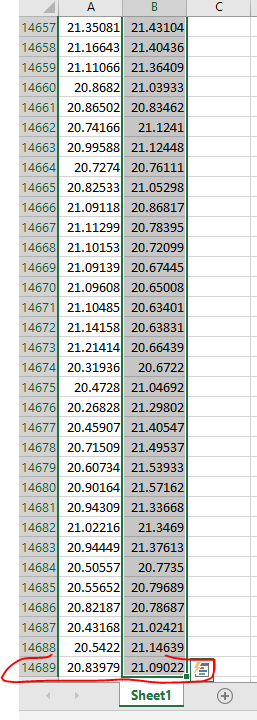
But the issue is that I can’t easily tell where each iteration results start and end, as the data is being recorded for all iterations in one column in excel as shown in the image below. I mean I know I have 3672 hours for each iteration, so I can try and separate that manually in excel but given that I will be running around 7000 iterations, I’m looking for a more reasonable way of doing it. I thought of trying to iterate the sheets of excel through a slider so that each iteration is written in a sheet, not too sure how to link that to Colibri so that they are running in parallel.
What do you think would be the best approach?