Hello, I hope to help me , specially Mr @djordje. Iwanted to use LB to prove the feasibility of PV tracking system compared to fixed status. I followed information and files used the topic Retractable (operable) PV panel study which helped me in my task, but I can not understand why I should use the components in the figure below or what did it mean? the file attached below
RE fixed_vs_tracker_PV_ks2.gh (433.7 KB)
Hi @RadwaEzzat ,
It’s been few years since the creation of that .gh file, and I haven’t made it but Konrad.
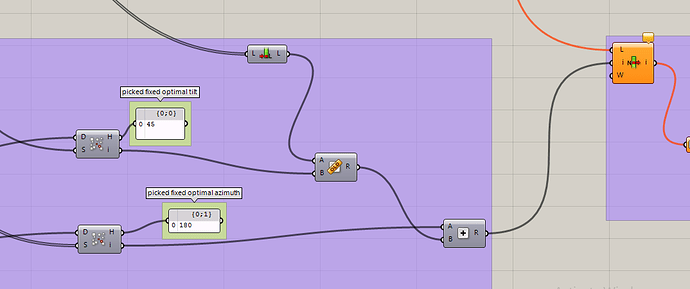
The value ‘picked fixed optimal tilt’ will take ‘step tilt angle’ closest to calculated optimal tilt angle.
‘step tilt angle’ is one value in a list of initialy defined tilt step angles (0, 10, 20, 30…90). Those are step angles for which tracking PV system will rotate from horizontal to vertical position.
The same with ‘picked fixed optimal azimuth’ - it is essentially ‘step azimuth angle’ closest to calculated optimal azimuth angle.
‘step azimuth angle’ is one value in a list of initialy defined azimuth step angles (90, 100, 110, 120…270). Those are step angles for which tracking PV system will rotate from East to West.
2 Likes
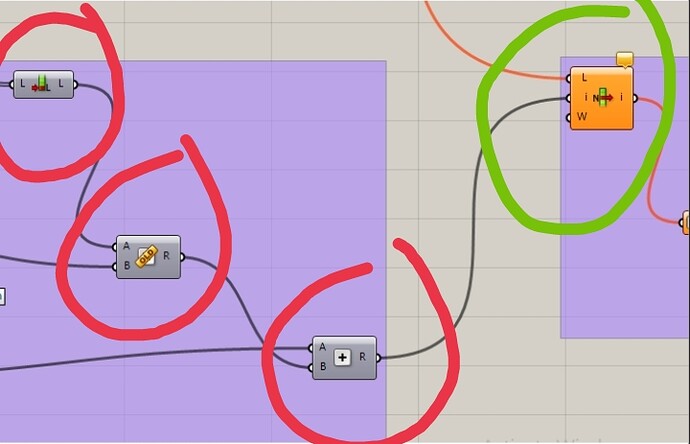
Thanks @djordje I understand what you explained but my questions, specifically, about the using of components marked with red circles in the figure below. I am sorry about this initial questions as I am beginner. What I understand that We need to extract Ac energy value of the fixed position (tilt and azimuth angle value) from AC energy result list so we defined it through component marked with green circle, but what I still don’t understand is the using of red circle marked component.
Hi @RadwaEzzat ,
I don’t remember to be honest, it was some time ago.
Ok mr @djordje . Generally , from PV surface components, here we can get energy per year or per hour output, Can I ask about how can I get energy per year for a specific PV area (result in KWh/ m2) ? Is it possible? Thanks
Hi @RadwaEzzat ,
I apologize for taking me too long to reply.
PVsurface outputs results in kWh for each hour during the year, and also sums up each hour during the year to show the total annual output in kWh.
If you need the annual results in kWh/m2 you have to divide the upper value with the area of the “_PVsurface” input.
Attached is an example how to do that.
PVsurface_results_in_kWh_m2.gh (384.6 KB)

