I edited this question and topic to streamline it.
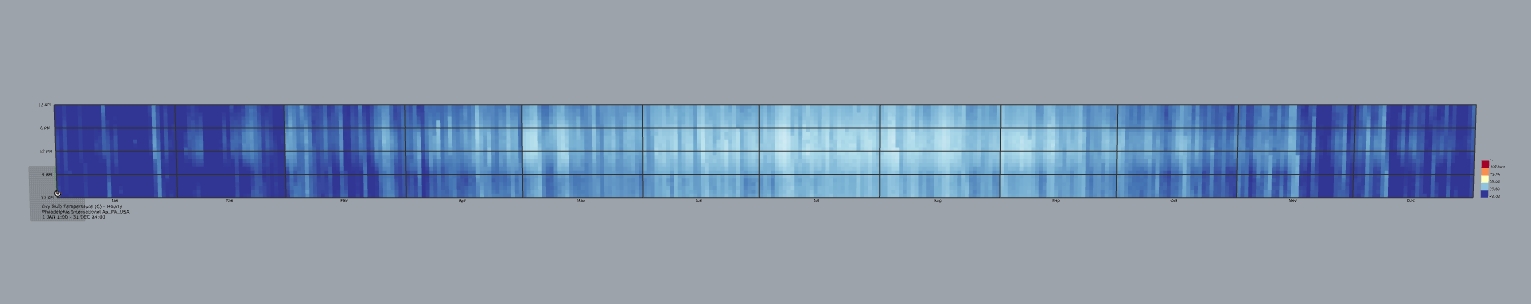
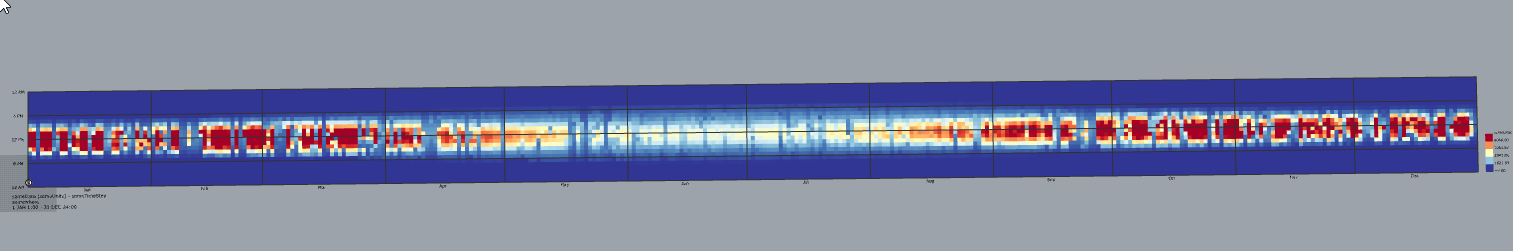
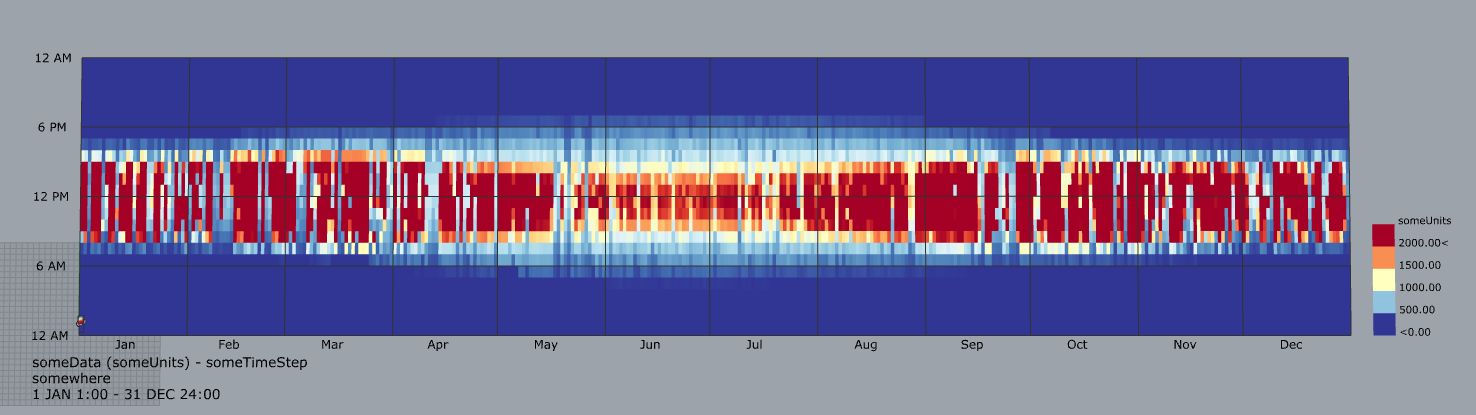
I’d like to show some Annual Daylighting results, but with a 3D chart across the whole year, with months and days and hours. Basically, I’d like to use the 3D Chart for the whole year as shown in Mackey’s video here (https://youtu.be/sRfd4K3b9ew), but instead of just plotting EPW file values, I’d like to plot values as a result of an annual daylight simulation. I basically want one of these graphs, but with annual daylighting information:
This example works great for annual daylighting analysis:
http://hydrashare.github.io/hydra/viewer?owner=mostaphaRoudsari&fork=hydra_1&id=Honeybee_Annual_Daylight_Simulation_Example
And the resulting ‘annual_analysis_file’ looks like this (with default occupancy schedule):
unnamed_0.ill (2.9 MB)
If I’m understanding it correctly, it is the daylighting of each grid point (112 points) for each hour of each day of the year.
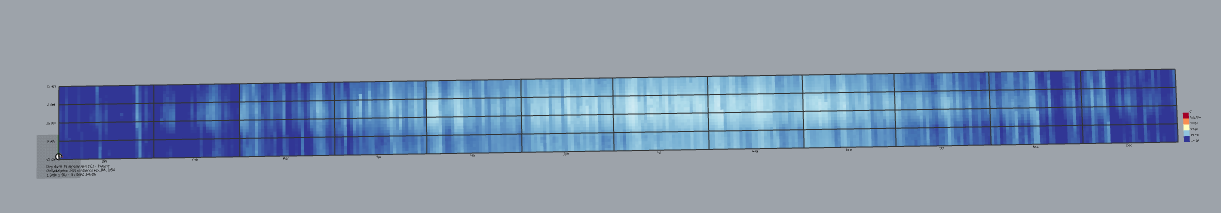
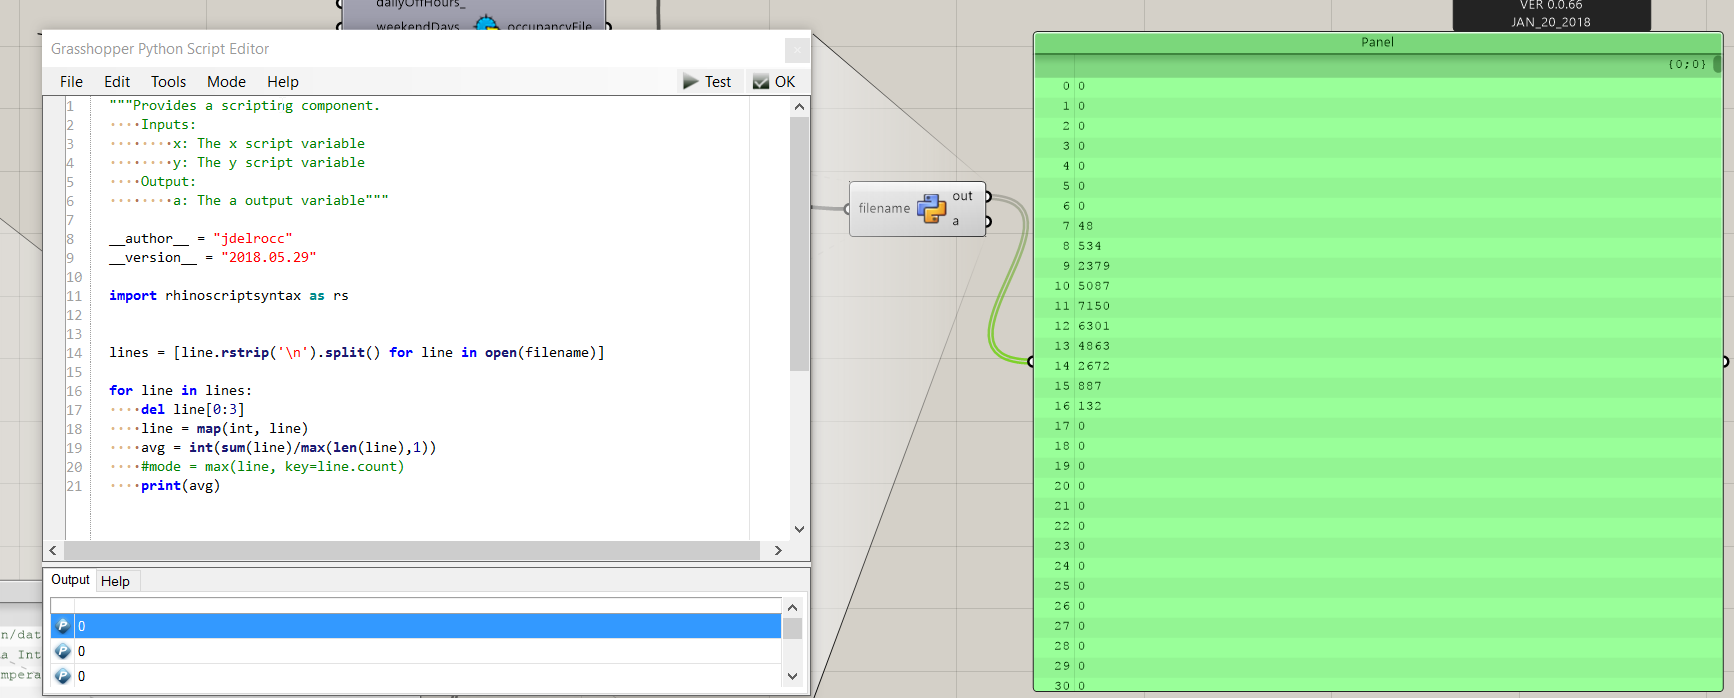
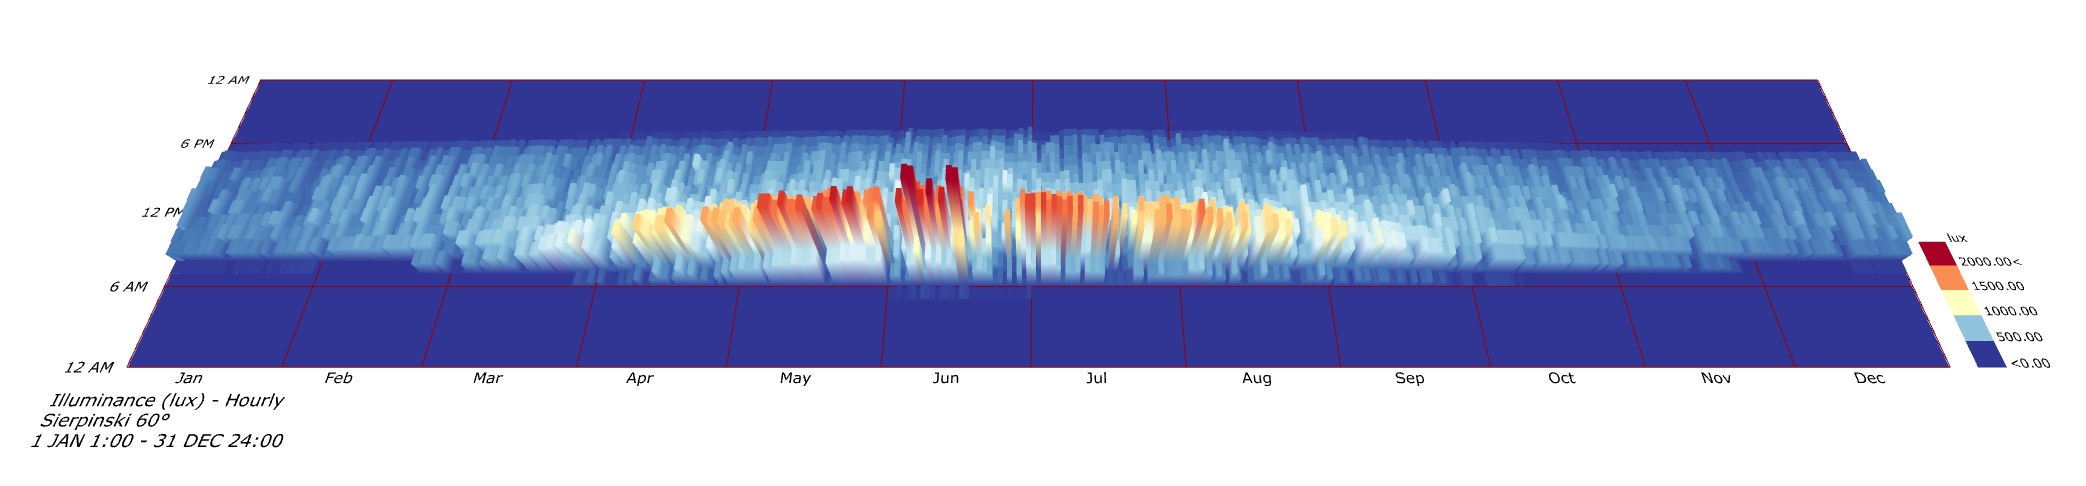
I’ve taken this .ill daylighting information and averaged it per hour of the year:
Now how do I put this in a format that is friendly for the Ladybug 3D Chart component so that it plots the values throughout the year with month and time axis?
Thanks for any help!
So the reason for my technical question, of how to prep the data for the Ladybug 3D Chart so that it can graph data throughout the year, is because I’m not sure exactly how the data must be formatted for it to work properly.
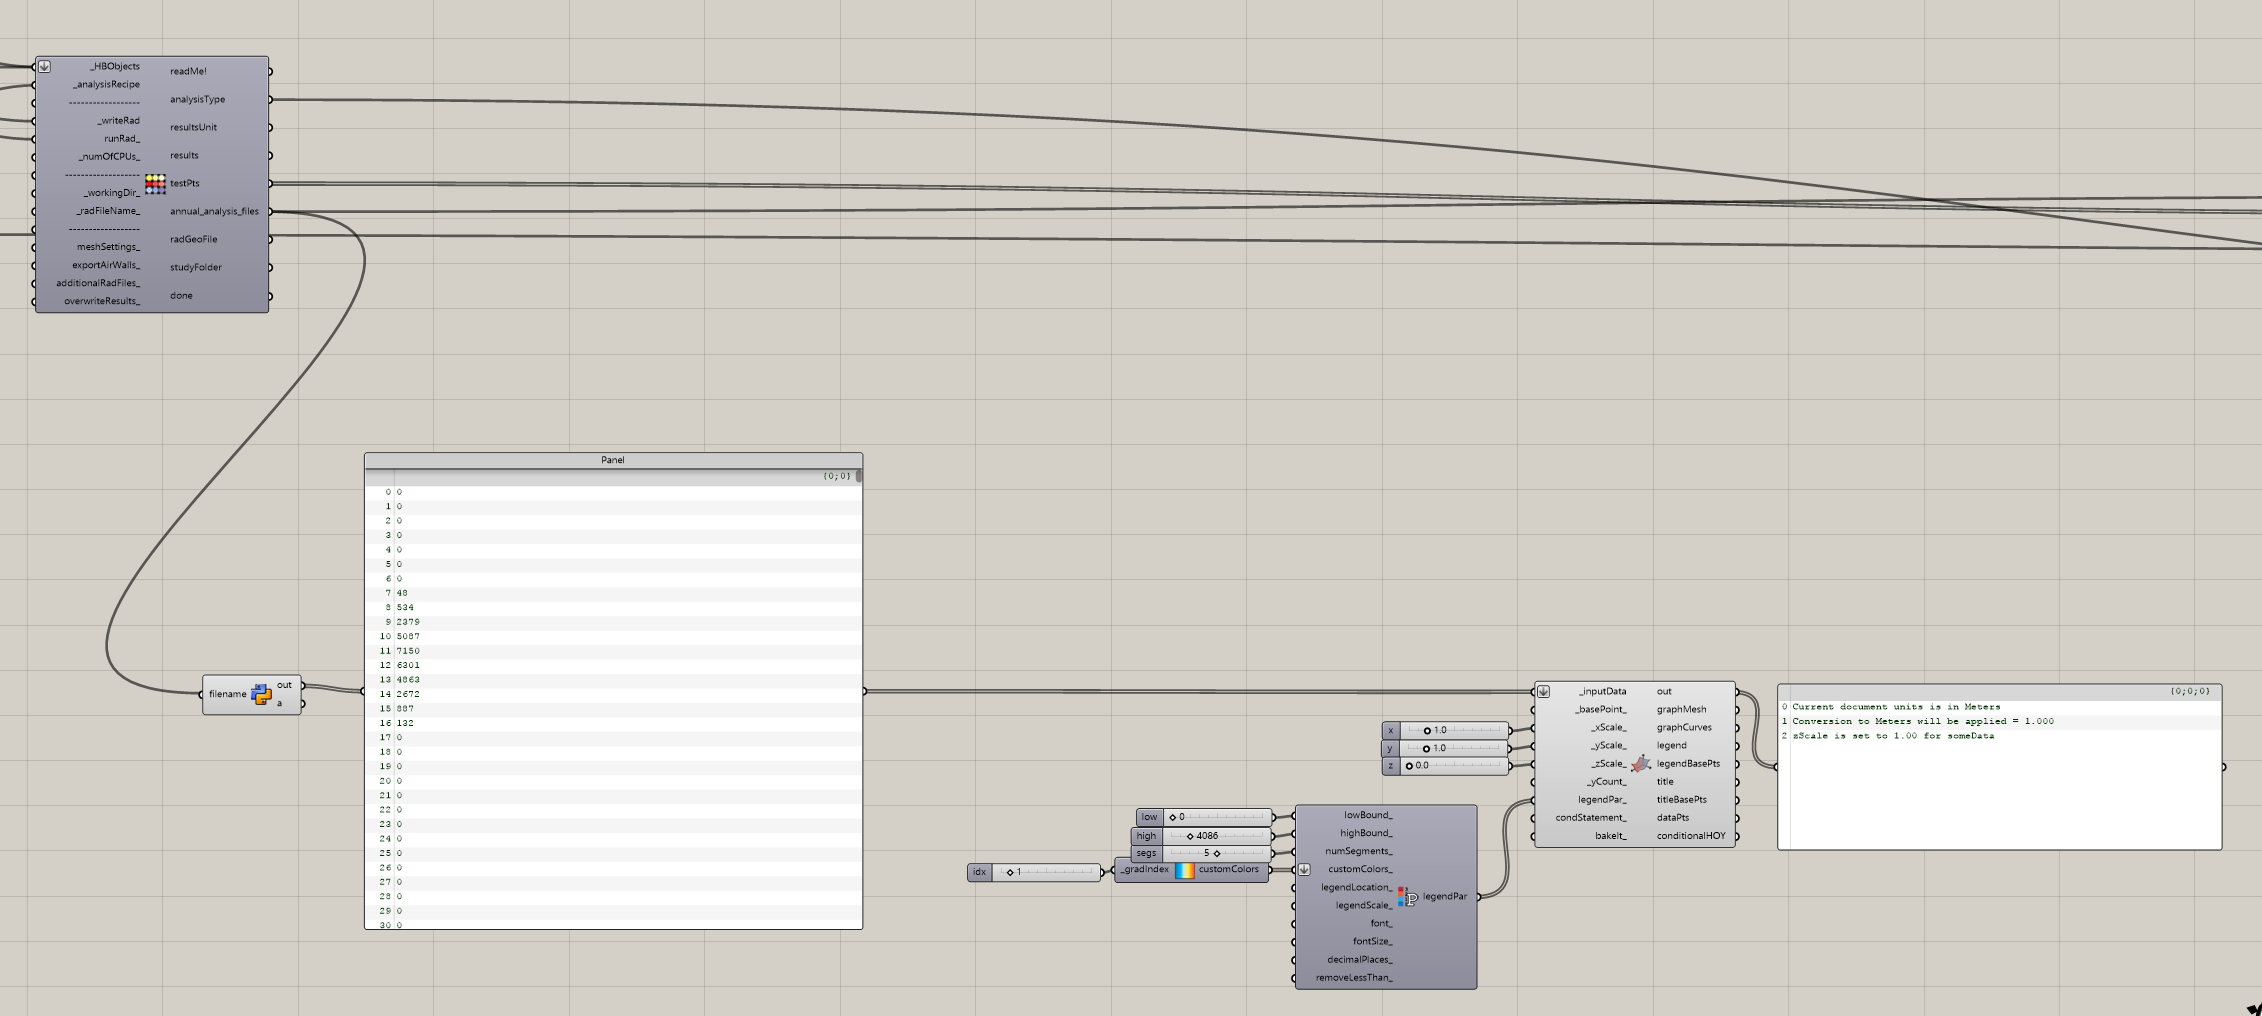
This works:
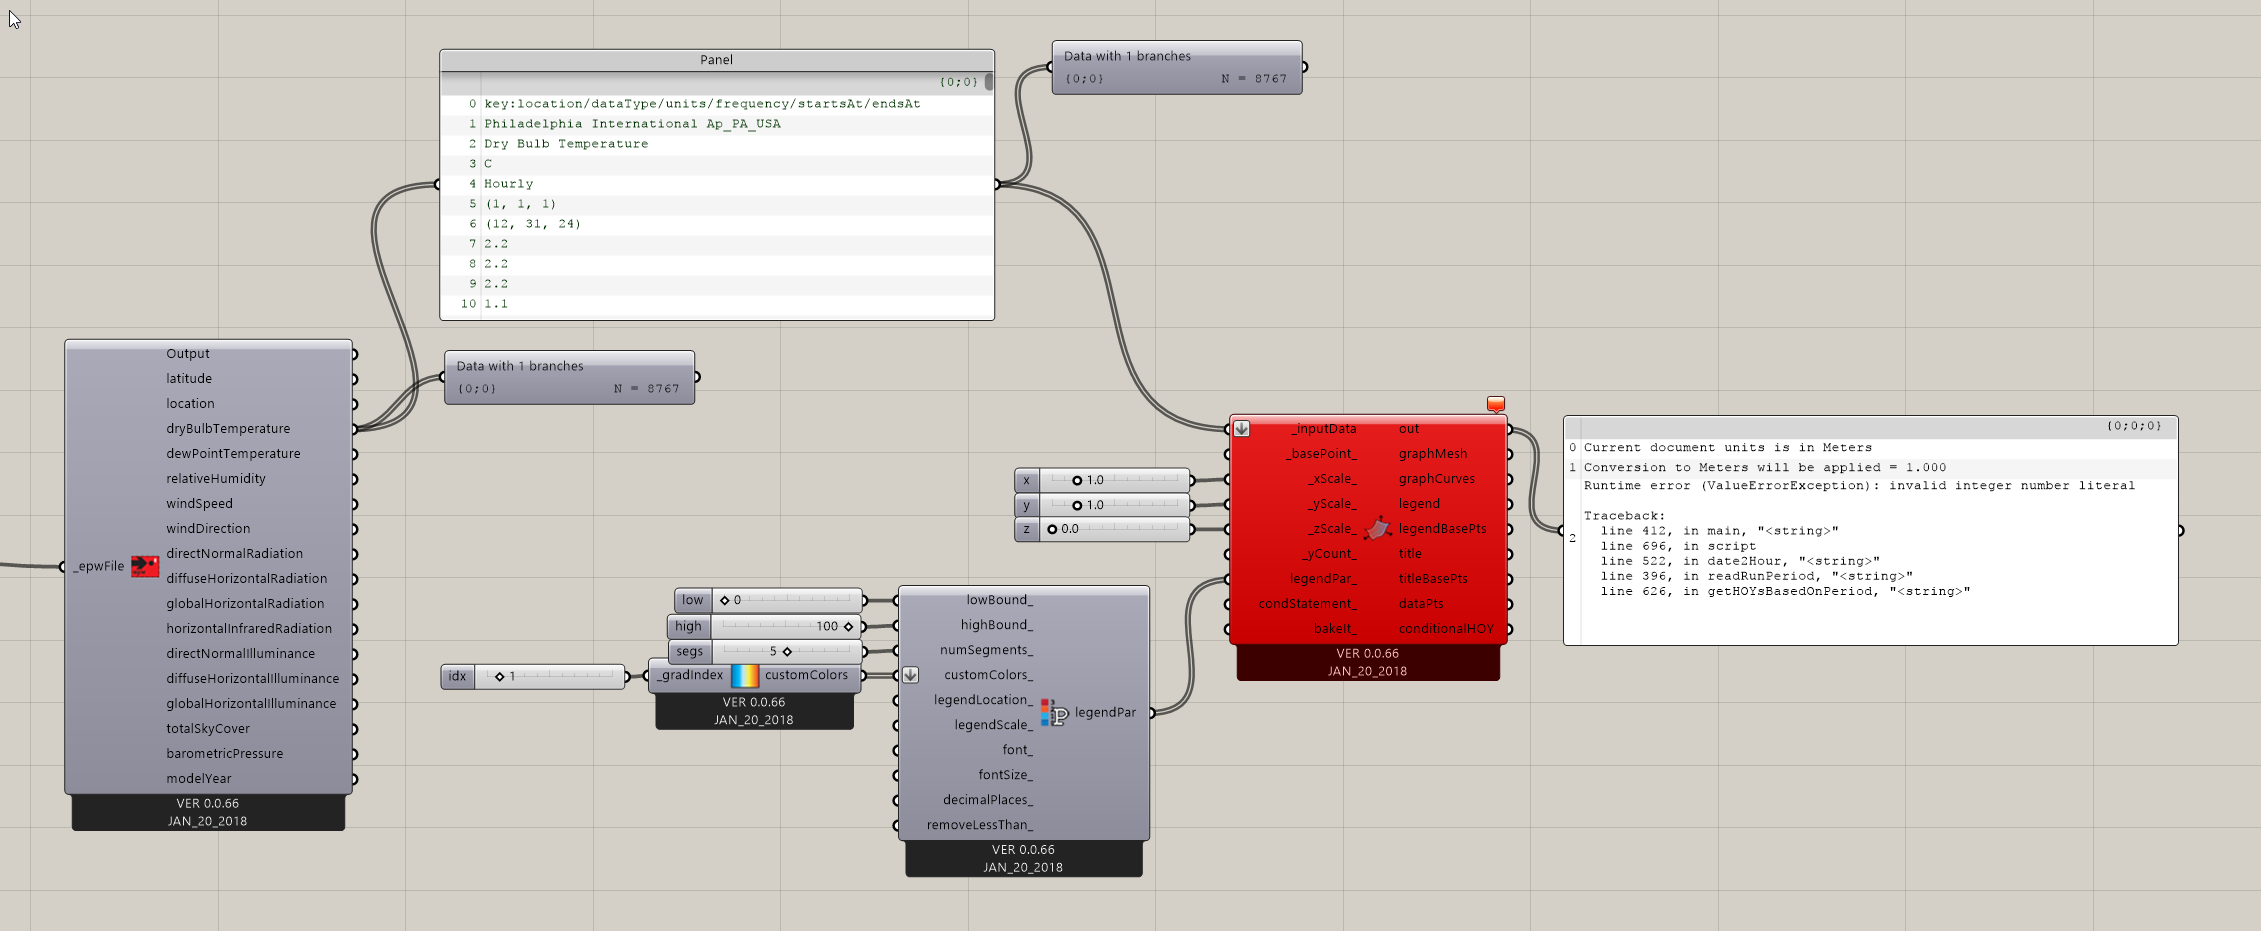
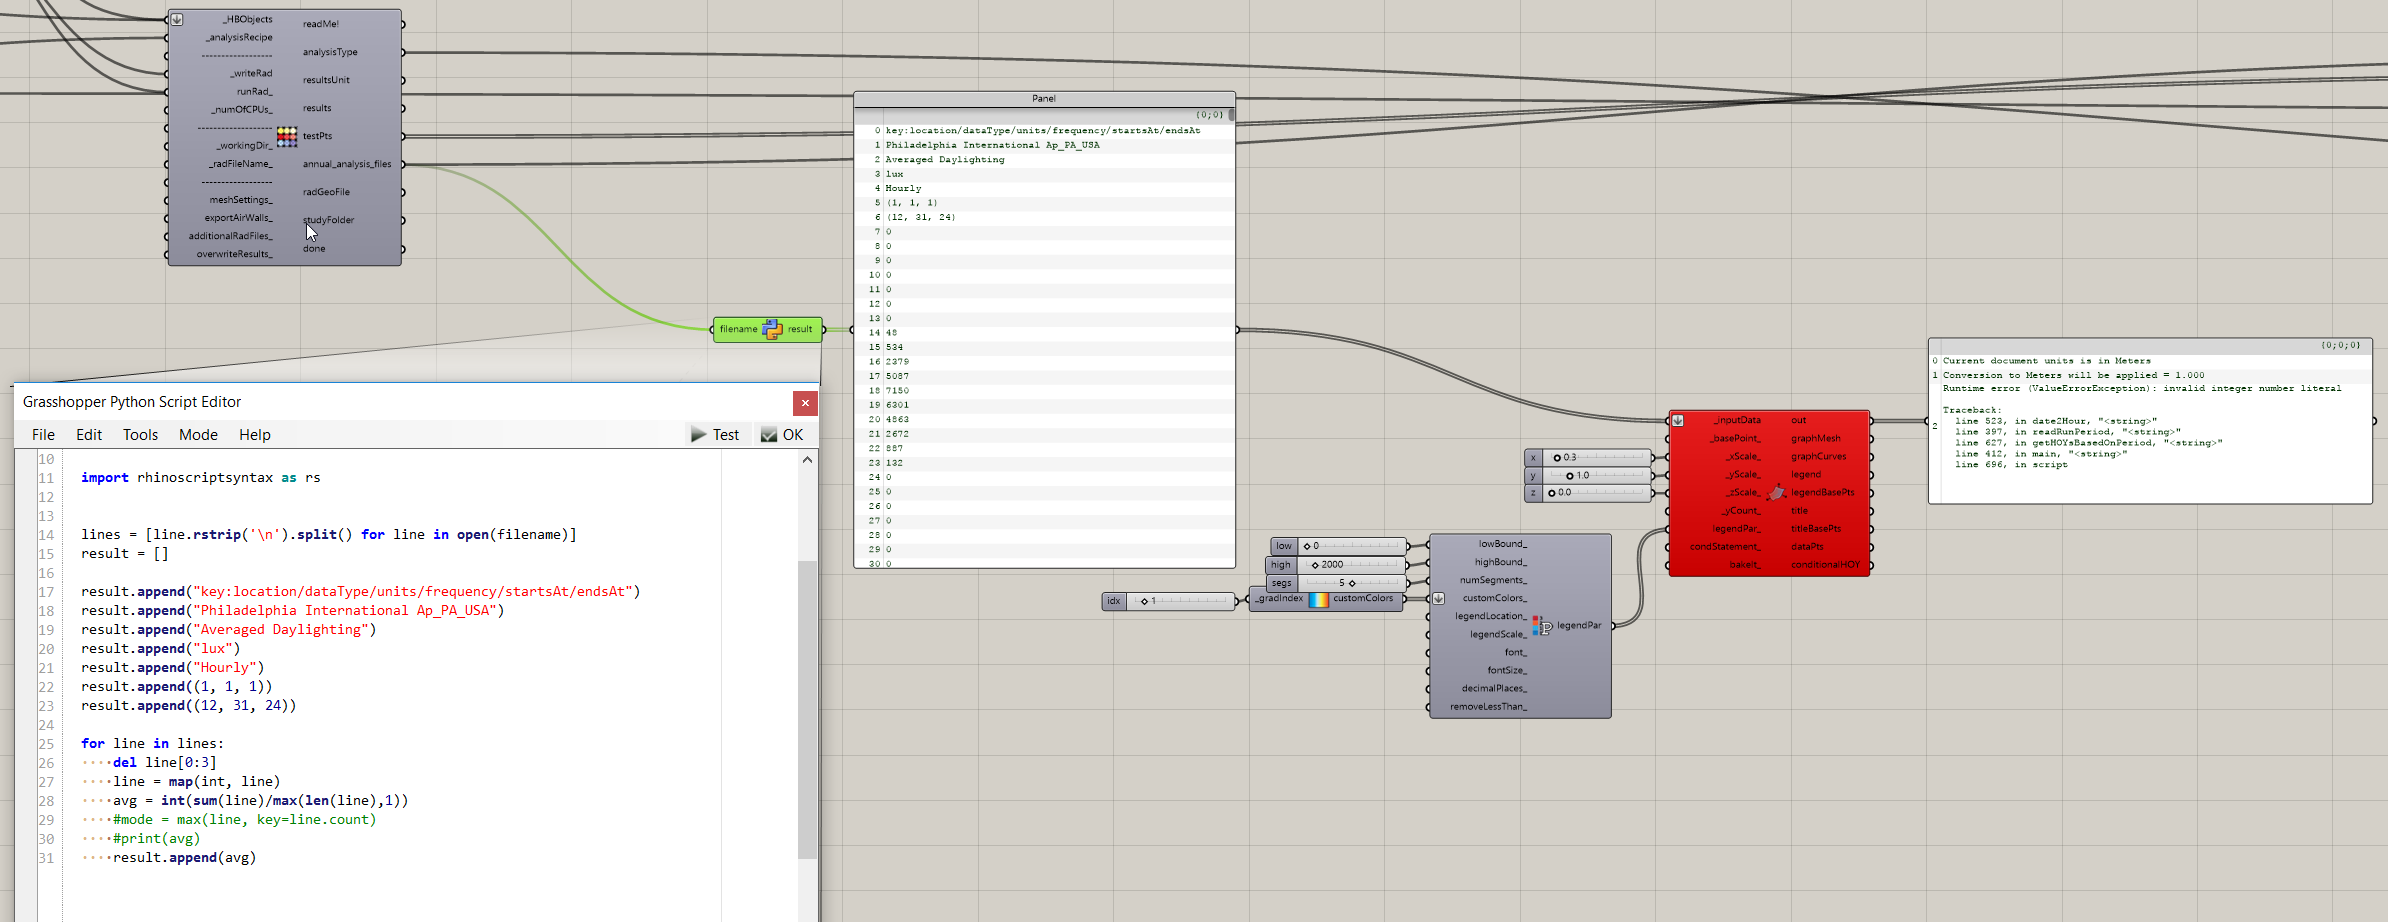
But the same output from a panel doesn’t work:
So I’m not sure if I feed a generted list of similar data if it will work or not.
Assuming I had 1 averaged daylight coefficient value per hour of each day of the year (which I do), how do I store that in a format that this Ladybug 3D Chart can use to display the value throughout the year? (like Mackey’s video)
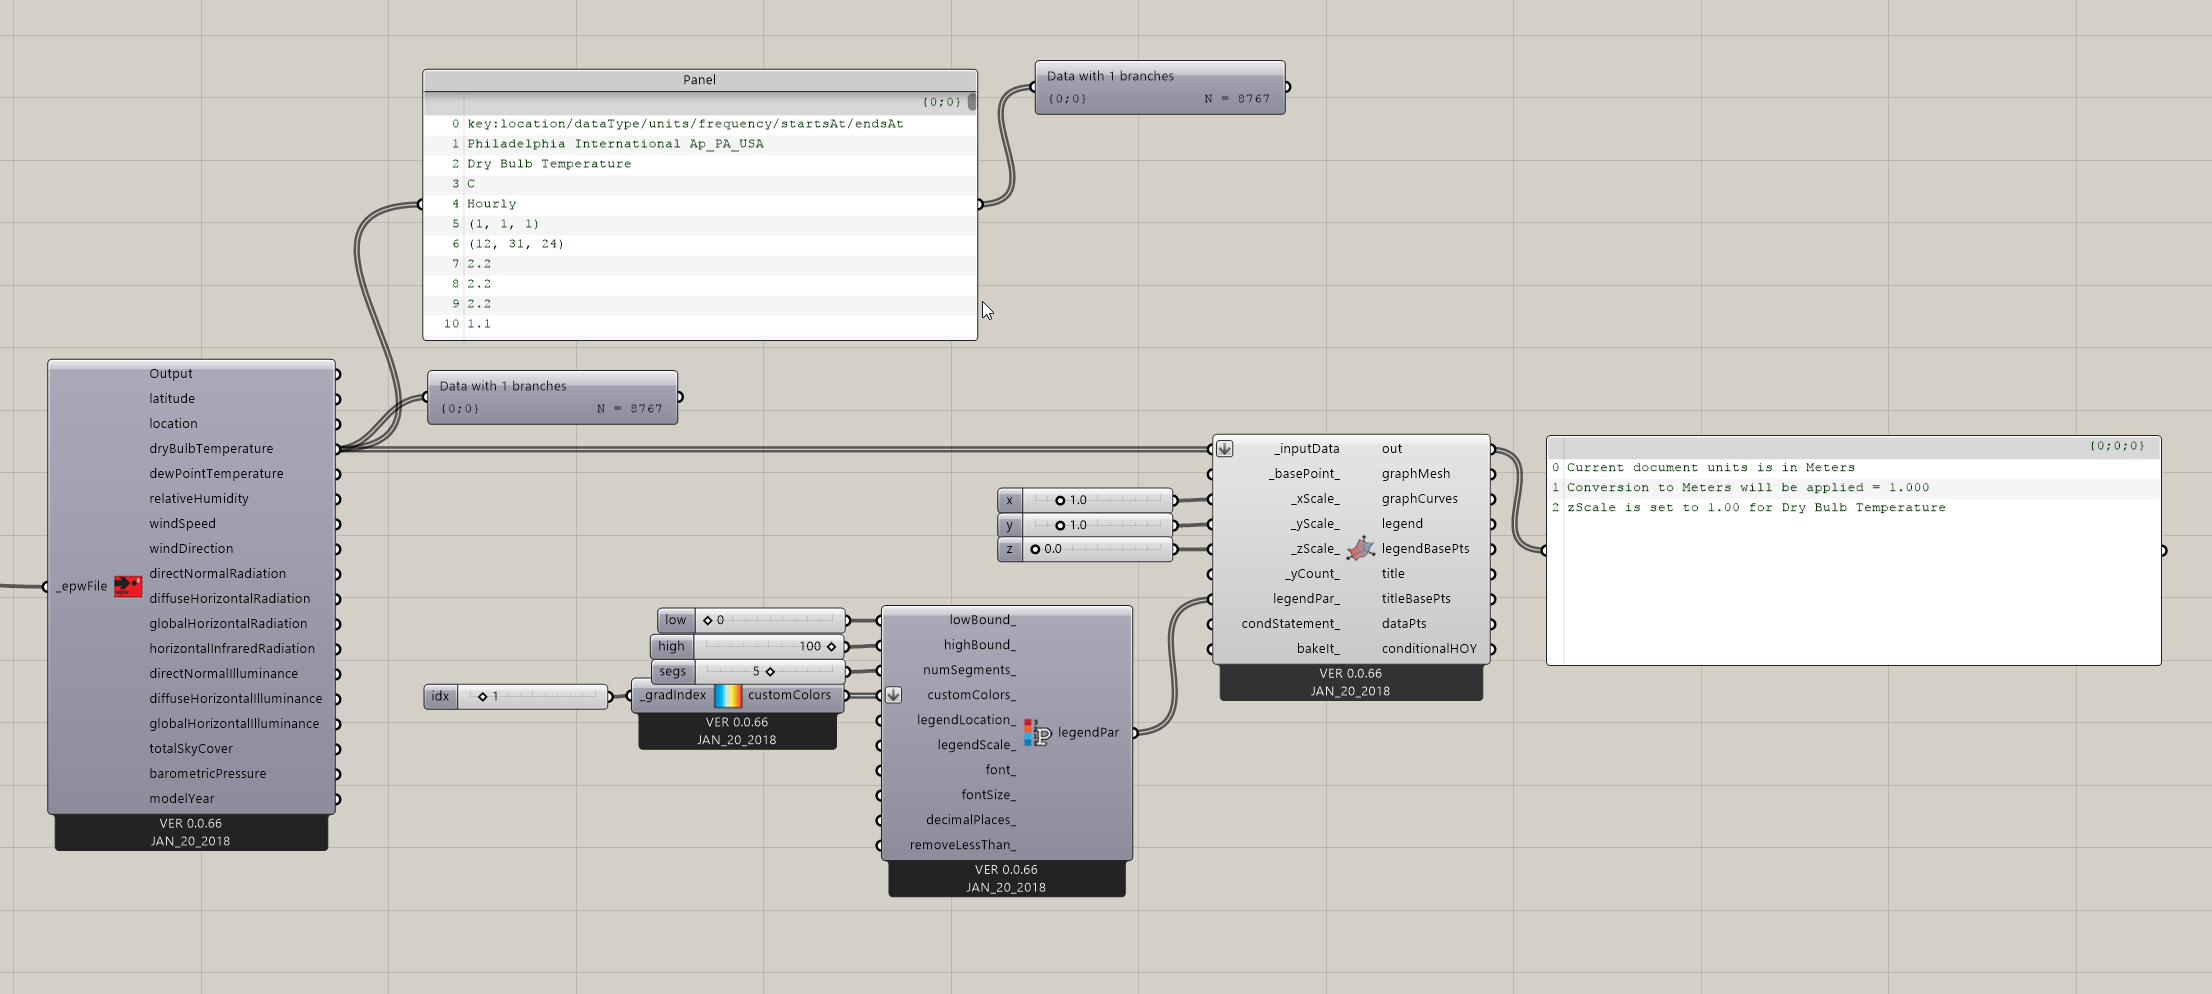
I assume it’s because the list of data coming out of the Ladybug Import EPW component is specific types, like sets, floats, etc., and that is getting converted to strings in the scribble panel.
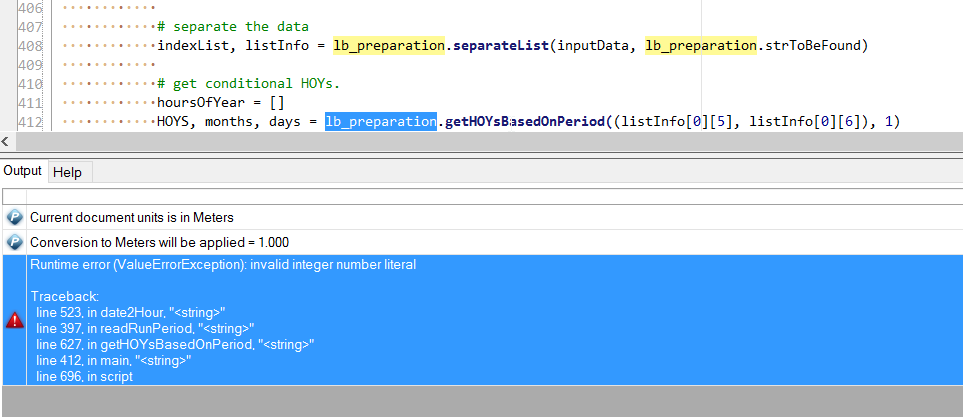
It looks like the error happens when the Ladybug 3D Chart is trying to pull the startsAt endsAt period:
(1, 1, 1)
(12, 31, 24)
I’m not familiar enough with Grasshopper API to be able to format my data properly for the Ladybug 3D Chart component as it needs it. (in fact I don’t even know the exact formats it needs).
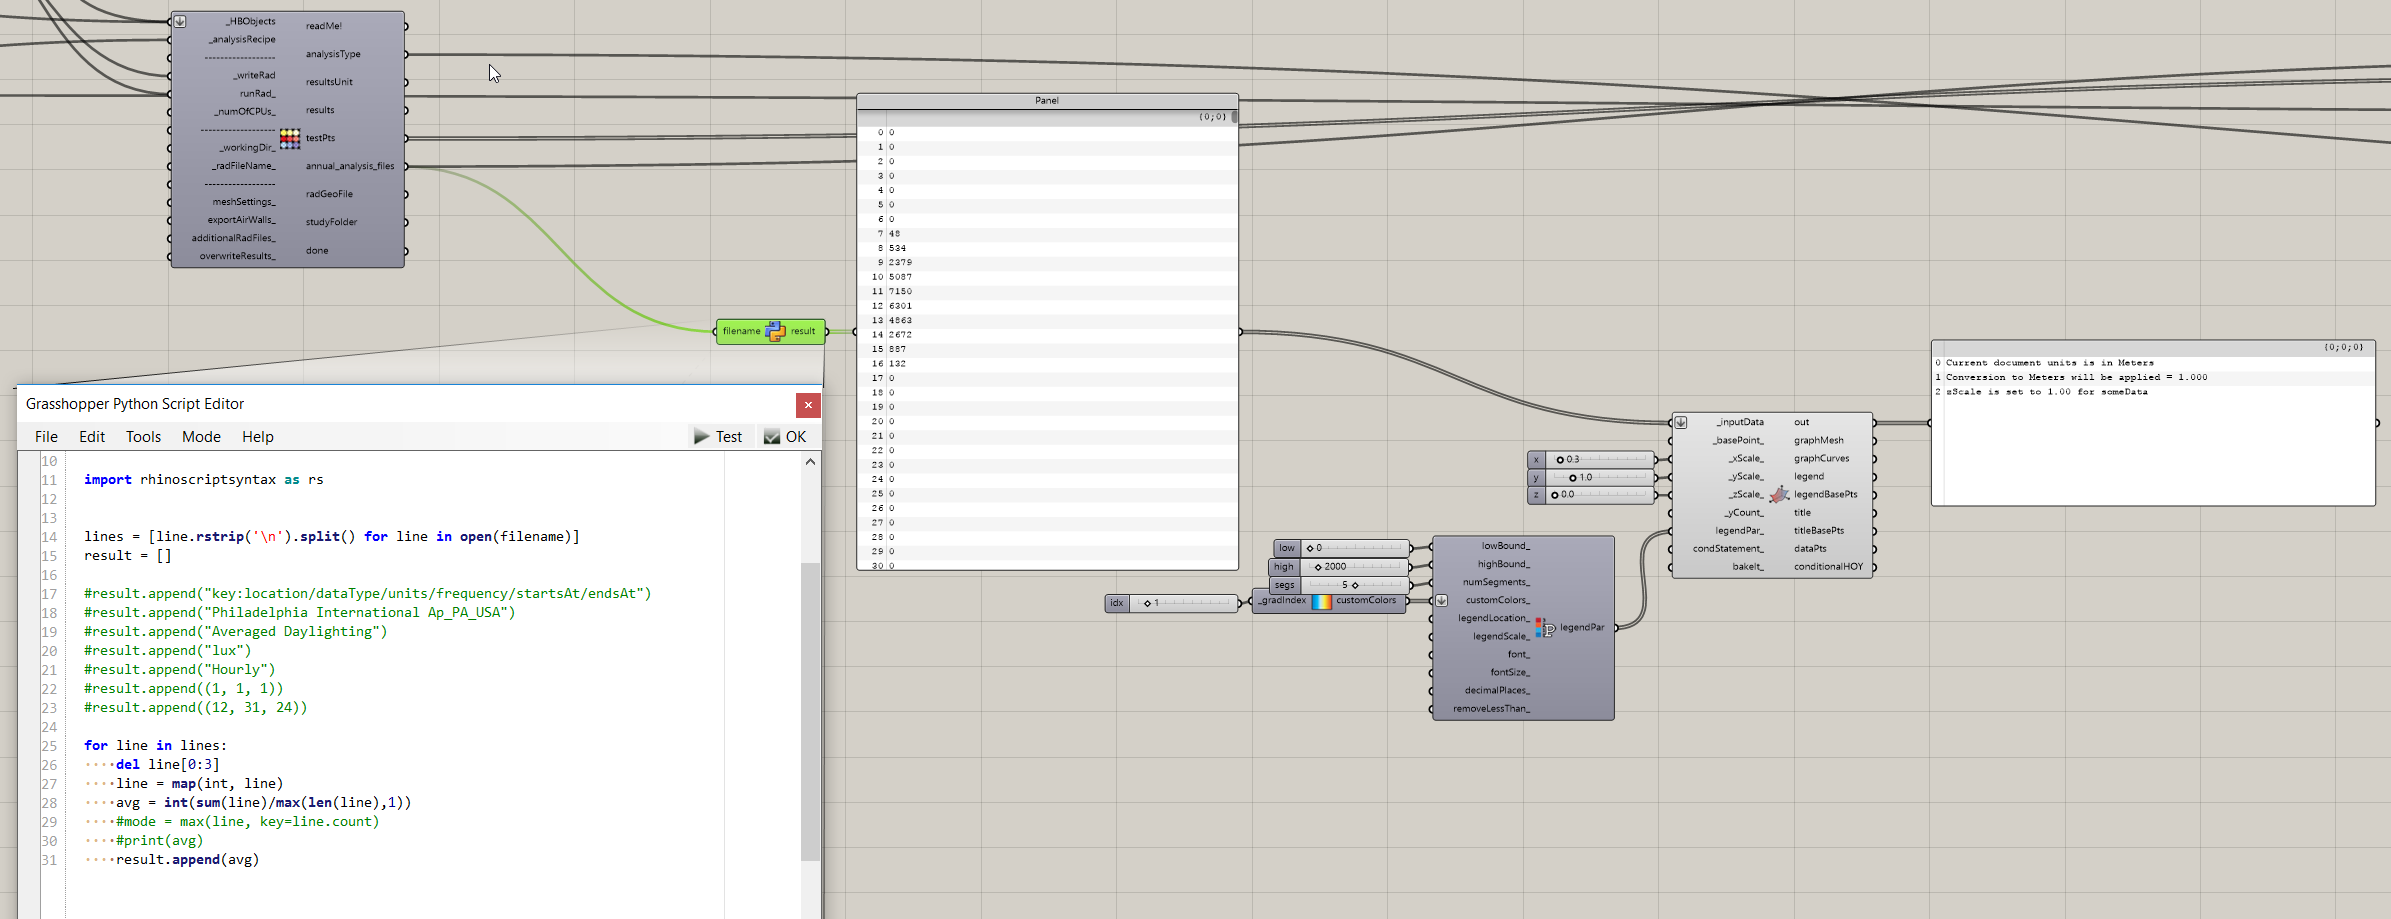
Well… I just threw the list of averaged daylighting values into the 3D Chart and it worked just fine. I guess I should have just shot first and asked questions later lol.
I thought I would have needed that other information for the yearly startsAt endsAt, units, etc. But perhaps not. I mean how does the chart know which values correspond to which hours or days or months? Is it because I’m giving it a value for every hour of the year that it just works?
So if I include any of the text that I assume is used for the chart title, units, start/end… then the chart component doesn’t seem to like it. Either I’m adding it in the wrong format (likely), or there’s a bug with the chart component.
This doesn’t work:
This works:
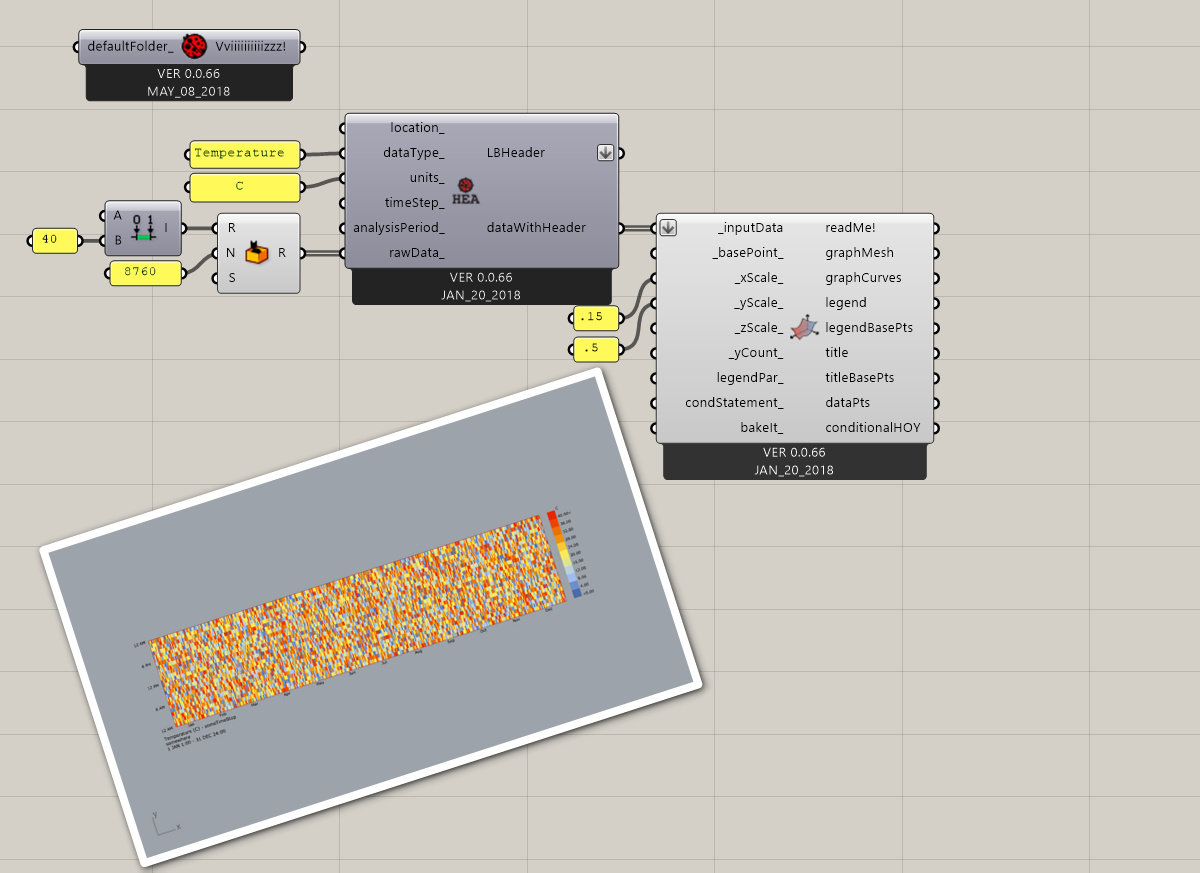
Try the LB_Header.
You can also include here your file. Will be easier to debug.
-A.
Here you have an example of the header.
-A.
Worked perfectly, thank you!
Averaging illuminance values for daylight is not a good idea. There has been a lot of research and anecdotal evidence against this. I would suggest looking into metrics like UDI and others.
Most of the metrics mentioned in those papers are already implemented in Honeybee.
Thank you very much!
I agree, and am already using Honeybee’s ‘Read Annual Result I’ component to show the UDI percentages for the case study. I had experience doing that in DIVA as well previously. You are right that averaging them is somewhat arbitrary, especially the larger the space and variance of values.
These charts are pre-case-study and used show the difference in light amount throughout the year with a few different facade configurations on a small-ish (8’x10’) room shell with no furniture or nooks and crannies. They just give a rough estimate of how the overall light is changing with each configuration. Perhaps we should leave the legend out for these…