Hey everyone,
I seem not to find a solution …I have made a small shadow study of a couryard and I want to create contours for each value out of the mesh generated by the Ladybug Sunlight Hours Analysis component.
Thanks!
Mihail

Hey everyone,
I seem not to find a solution …I have made a small shadow study of a couryard and I want to create contours for each value out of the mesh generated by the Ladybug Sunlight Hours Analysis component.
Thanks!
Mihail
Mihail,
Could you attach your GH file along with an explaination in the GH file of what you are trying to achieve. Its not clear to me what you are trying to achieve here.
Anton
Hi Mihail, Check this Hydra. It’s pretty easy to generate a 3D Mesh with the new Re-ColorMesh component and you can use Grasshopper’s contour to contour the mesh.
Thank you, Mostapha.
This will prove to be helpful.
Thanks to both of you for responding! Sorry for not making it more clear Anton, however Mostapha understood what I meant.
It looks easy now when I see it 
I would open a new discussion. The process in the Hydra file actually works with a 3d mesh. There is no such a warning in the component. You’re probably using the new component and not the one in this example.
Hi! I want to make contour lines that stretch around the complex geometry of a building. Ive done a Vertical Sky Component study and want to map the contour results on the building facade.
However, mesh needs to be planar for this component to work, or it needs to be a 3d mesh created by LB colour mesh. Is this correct? Is it possible to do what I want done?
Hi Ludvig, The way the contours are generated right now is by extruding the mesh and then calculate mesh plane intersection. There are mathematical solutions to find the contours based on points and values but I haven’t tried them myself. Here is the d3 example: https://github.com/d3/d3-contour/blob/master/src/contours.js
Hi there,
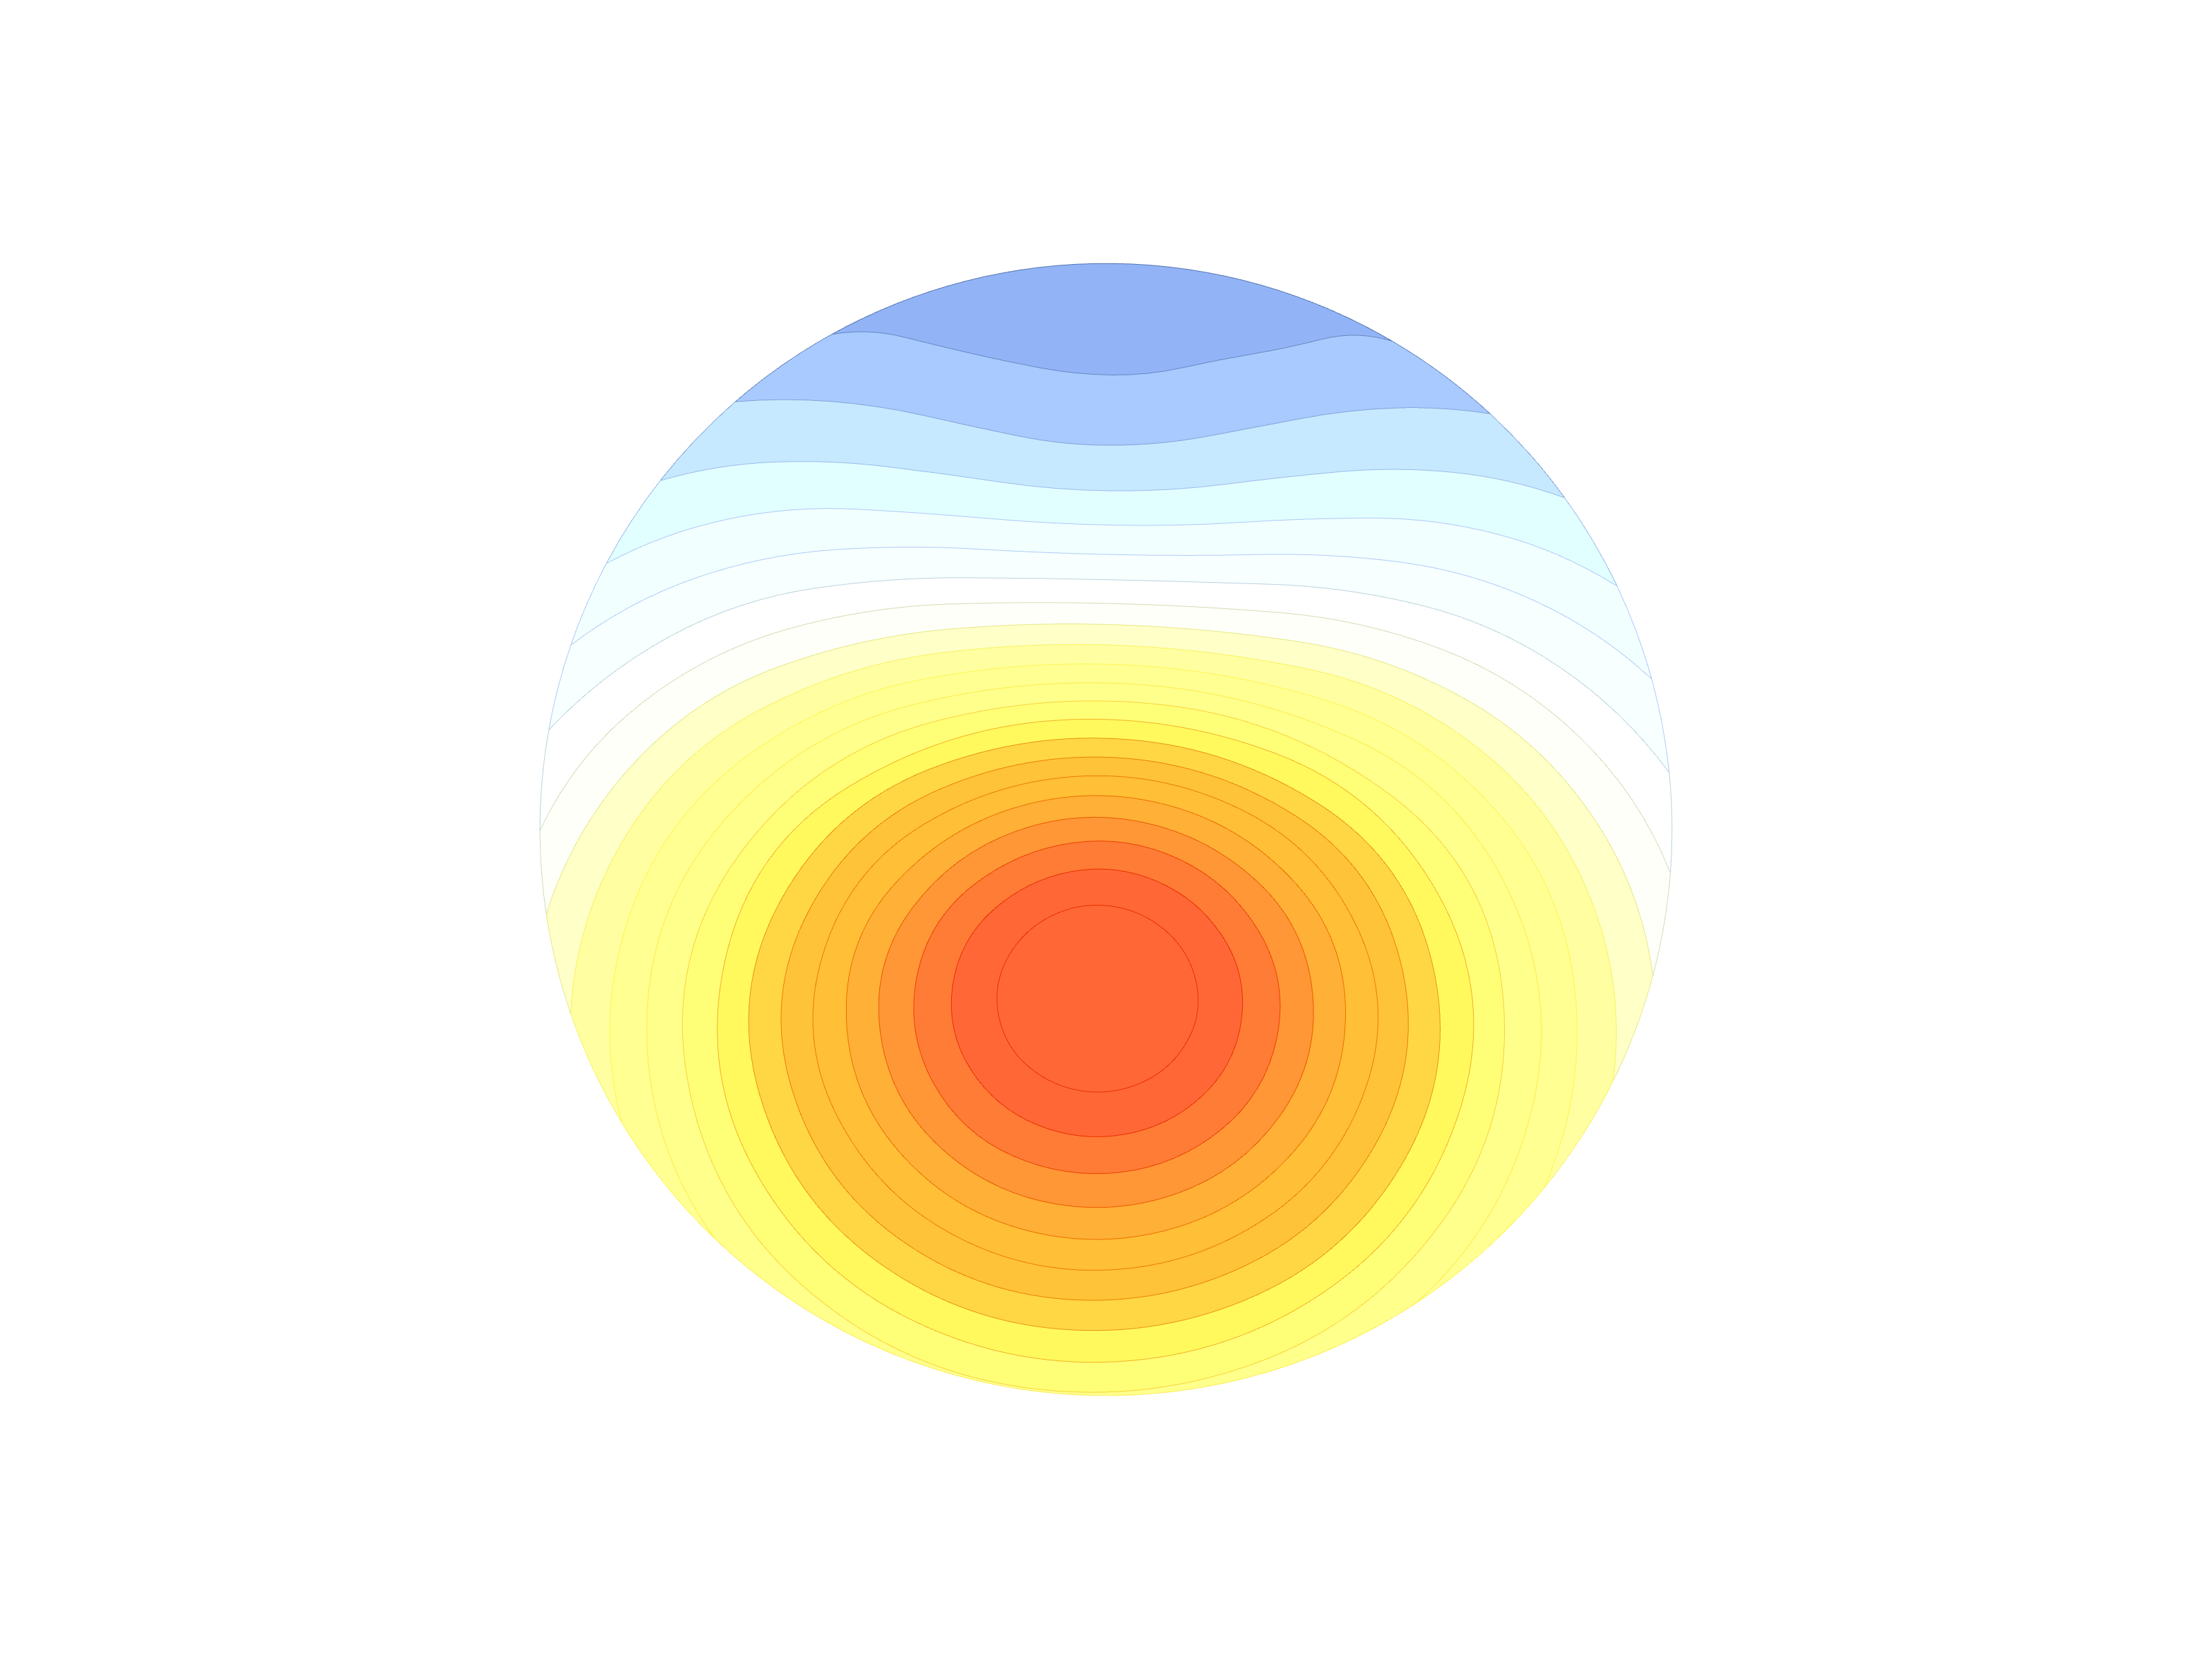
I am reviving this topic as I would like to enhanced the radiation solar dome with iso-value contour. I think this kind of plot is a lot more readable with those lines or with discret colors.
After few searches, the algorithm behind the hood seems to be “marching square” (more info here)
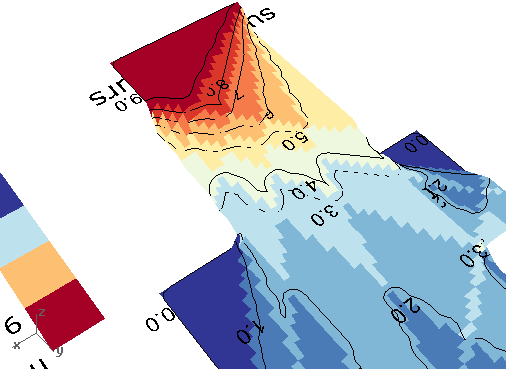
An alternative is to extrude the mesh (if it is flat / with Z = vertex value) and do plane intersection (with Z plane = iso value) and project back the contours on the mesh. This is what this legacy component seems to do right ? Are there any plans to add it to LB 1.6 ?
Hi there,
I finally sort this out my self by “reverse-engineering” a component from the millipede plugin. More information on wikipedia (here).
Attached find a grasshopper definition with custom C# components that do the job.
@mostapha & @chris : is it worth to implement that in LB ??
If yes, let me know if you want me to do something about it.
marching square isocurve.gh (48.6 KB)
Thanks for the sample, @lionpeloux .
The methods we used in Legacy were just too unreliable, which is why the component never made it out of WIP and why we aren’t really considering porting it over to LBT. The Legacy component used Rhino’s Mesh/Plane intersection methods on a heightfield version of the mesh. It was honestly pretty impressive that this method worked for as many cases as it did and it’s a testament to all of the effort that McNeel has put into its intersection functions. But they couldn’t work for all cases, which is understandable when the mesh resolution starts getting coarse.
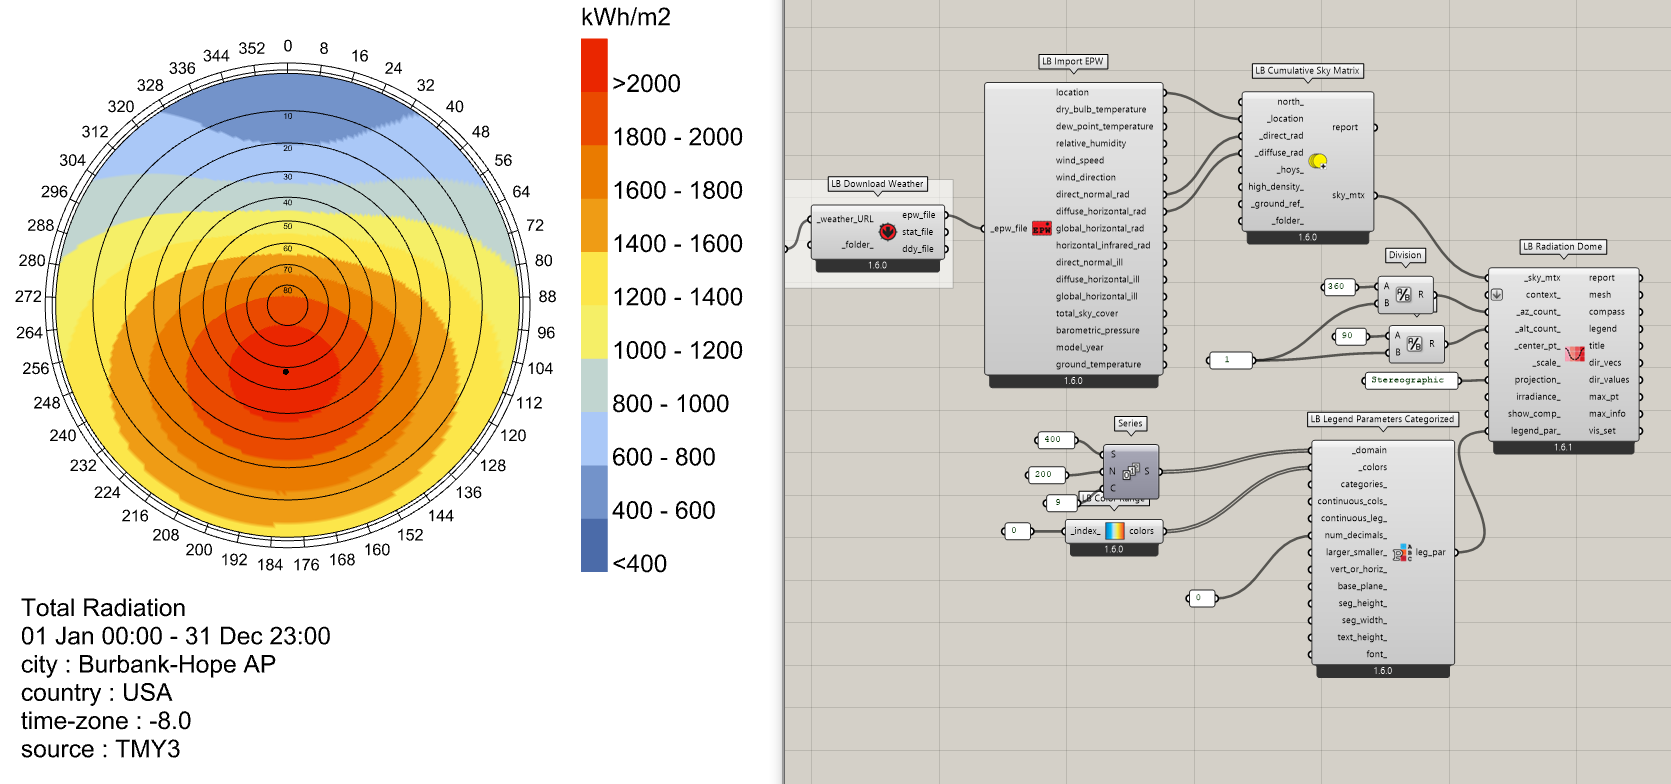
I would say that, if you are looking to replicate this type of workflow with the LBT plugin, you should just perform a high resolution study and use some LB Legend Parameters Categorized. Here is an example with the radiation dome:
I realize that this still does not give you contour polylines and that marching square routine seems pretty reliable for this purpose. So, if you wanted to wrap the marching square routing into a Python component that only gave the contour lines out (without the colored mesh), I would be happy to review and merge it. We’d just want to make sure that the implementation could generate contour lines for both meshes colored by face and meshes colored by vertex. But it looks like the marching square algorithm could handle this and it’s just a matter of swapping out the mesh vertices with the mesh face centroids.
Hi @chris,
Thanks for answering. I didn’t know about this categorised option, good to learn that.
Here is a pythonic version of the marching triangles (inferred from millipede gh plugin) if you want to do something about it (see also attached gh file). I think it should be more robust and a lot faster than the legacy version that relies on mesh/plane intersections (though it requiers to triangulate the mesh first).
Just for curiosity, have you ever discussed embedding a plotting backend to produce quality plots out of the box (like plotly) ? It’s of course really nice to have those professional plots directly in rhino. And I know I can export the geometry in (say) Illustrator to fine tune and export for presentations/reports. But that could be of great help to produce those plots (either statics or interactive html as plotly allows) at the speed of a clic from GH.
import rhinoscriptsyntax as rs
import Rhino as rh
import Rhino.Geometry as rg
import ghpythonlib.treehelpers as th

def GetTriangularMeshContour(triangularMesh, vertexValues, isoValue):
    isoLines = []
    num = 0
    num2 = 0.0
    num3 = 0.0
    num4 = 0.0
    num5 = 0
    num6 = 0.0
    array = [rs.CreatePoint(0,0,0), rs.CreatePoint(0,0,0), rs.CreatePoint(0,0,0)]
    print(array)
    for num in range(0, triangularMesh.Faces.Count):
        a = triangularMesh.Faces.GetFace(num).A
        b = triangularMesh.Faces.GetFace(num).B
        c = triangularMesh.Faces.GetFace(num).C
        num2 = isoValue - vertexValues[a]
        num3 = isoValue - vertexValues[b]
        num4 = isoValue - vertexValues[c]
        num5 = 0
        if (num2 * num3 < 0.0):
            num6 = num2 / (vertexValues[b] - vertexValues[a])
            array[num5].X = triangularMesh.Vertices[a].X + (triangularMesh.Vertices[b].X - triangularMesh.Vertices[a].X) * num6
            array[num5].Y = triangularMesh.Vertices[a].Y + (triangularMesh.Vertices[b].Y - triangularMesh.Vertices[a].Y) * num6
            array[num5].Z = triangularMesh.Vertices[a].Z + (triangularMesh.Vertices[b].Z - triangularMesh.Vertices[a].Z) * num6
            num5 += 1

        if (num3 * num4 < 0.0) :
            num6 = num3 / (vertexValues[c] - vertexValues[b])
            array[num5].X = triangularMesh.Vertices[b].X + (triangularMesh.Vertices[c].X - triangularMesh.Vertices[b].X) * num6
            array[num5].Y = triangularMesh.Vertices[b].Y + (triangularMesh.Vertices[c].Y - triangularMesh.Vertices[b].Y) * num6
            array[num5].Z = triangularMesh.Vertices[b].Z + (triangularMesh.Vertices[c].Z - triangularMesh.Vertices[b].Z) * num6
            num5 += 1

        if (num5 != 0):

            if (num5 != 2 and num4 * num2 < 0.0) :
                num6 = num4 / (vertexValues[a] - vertexValues[c])
                array[num5].X = triangularMesh.Vertices[c].X + (triangularMesh.Vertices[a].X - triangularMesh.Vertices[c].X) * num6
                array[num5].Y = triangularMesh.Vertices[c].Y + (triangularMesh.Vertices[a].Y - triangularMesh.Vertices[c].Y) * num6
                array[num5].Z = triangularMesh.Vertices[c].Z + (triangularMesh.Vertices[a].Z - triangularMesh.Vertices[c].Z) * num6
                num5 += 1

            if (num5 == 2):
                isoLines.append(rs.AddLine(array[0], array[1]))

    return isoLines

# triangulate the mesh first
# in order to use marching triangle algo from millipede plugin

sucess = mesh.Faces.ConvertQuadsToTriangles()
isoContours = []

# for each isovalue
for j in range(0, isoValues.Count):
    isoLines = GetTriangularMeshContour(mesh, vertexValues, isoValues[j])
    isoContours.append(rs.JoinCurves(isoLines))

a = th.list_to_tree(isoContours, [0, 0])
marching triangles isocontours on a mesh (python vs C#).gh (55.0 KB)
Hey @lionpeloux ,
Sorry for the late response and thanks for the code sample. Triangulating quad meshes isn’t an issue but I see that your method there only works when the values are assigned to the mesh vertices and not the mesh faces. Given that values assigned to faces are mush more common in Ladybug Tools, I think any official component would need to support it. I imagine that there’s some way to adapt the code to that case and I’ll try to take a look at some point. If you figure out how to do it in the before then, I’d be happy to merge it in.
Yes, have you taken a look at the ladybug-charts package? It has plotly implementations of many of the ladybug graphics and creates them from ladybug-core objects. I’ll admit it hasn’t been updated in some time but we’re planning to embellish and maintain it as an important facet of many Pollination Apps.
Hi @chris,
No worries. Few questions so I can move on :
The radiation rose has its values given at vertices and in rhino vertices hold texture/color information if I am right. So it seems logical to me to work this way. But I understand that for an hourly-plot / psycho-chart values are likely to be defined at faces. And it probably also make sens to draw isocontour on this kind of plots too.
Implementing an isocontour/isoband algorithm is simpler (and more generic) on a triangular mesh. So if it is not a problem to triangulate the initial mesh, maybe this is the preferred way to go now.
Furthermore, a quad mesh has it faces not necessarily planar and that can lead to unwanted results (like isovcurves not exactly drawn “on” the mesh). Anyway, would you see a use case for 3D mesh ? Shall we assume this function to work only for planar XY quad mesh ? I need to make some assumptions on the mesh.
Is this the place to find the actual implementation of your mesh object : ladybug-geometry/ladybug_geometry at master · ladybug-tools/ladybug-geometry · GitHub. I see in this code base that you already have a triangulate() method and a _is_color_by_face property.
Oh great, I’ll have a look on this project :
Yes, have you taken a look at the ladybug-charts package?
Useful References for marching square / meandering triangles :
Thanks, @lionpeloux ,
Yes, the radiation DOME assigned the values/colors to the mesh vertices but it’s one of the few Ladybug Tools graphics that does so. Almost all of the others assign the values/colors to individual mesh faces. If you needed to map these values to a list of points, you can use the Mesh3D.face_centroids to do so. The only issue will be that there isn’t really a property that tells you how all of these face centriods are “connected” to one another like what you might have with a vertex-based coloring. But you might be able to figure out something based on the proximity of the vertices to one another.
And, yes, this is the specific class that is used to represent meshes in 3D space across Ladybug Tools:
So an implementation for that class would make contour lines available for virtually all mesh-based Ladybug Tools visualizations.