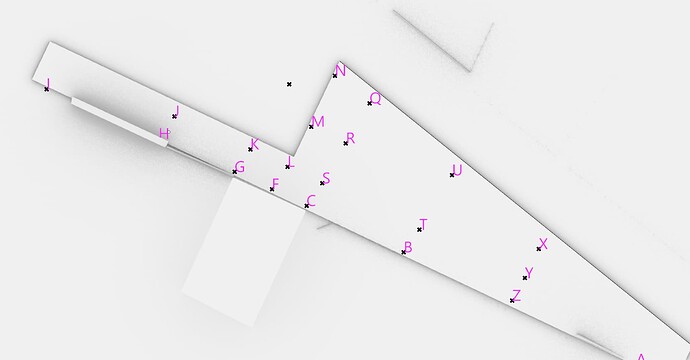
I have a grid of points from a wind tunnel test. I am modifying the wind speed at each point by the coefficient relating for each wind direction its relationship to the wind speed at the airport. This requires me to create a mesh with the same 20 Faces as the data points in my calculation. This should allow me to feed the wind data into individual PET calculations and thus plot PET and the effect of design changes across the site.
I have tried a range of different points to mesh options, but none have the neat points to faces relationship that is shown by the LB Genpoints component.
Any and all suggestions welcomed.
Delauney and Voronoi native Grasshopper functions looked promising, but matching the faces to the 20 points is proving a nightmare.
The shape of the site to be assessed is not simply approximated by the GenPoints command
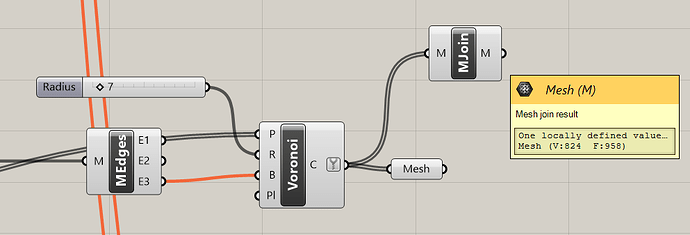
Using Voronoi creates small meshes at each point
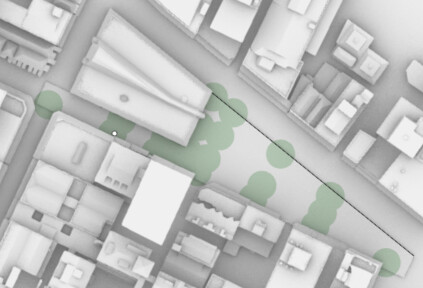
20 points but 958 faces in the joined mesh
And using Delaunay Mesh creates a mesh that is smaller than the park and measurement point area AND slides under a neighbouring building.
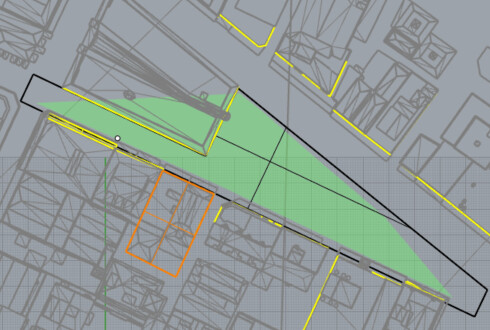
Though this mesh is closer in number of faces to what we are looking for.
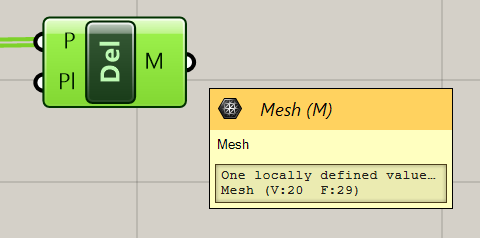
F:20 is what we want.
I have even tried a fix to interpolate between the measured points, ending up with 171 new points of data, but still face the same issue: the # of faces does not match the number of data points. The problem appears to be the assumed even spacing in X and Y directions for the LBT Mesh…
