Thanks for the help with the Natural Ventilation option (Honeybee Energy and Natural Ventilation appearing as a substantial cooling component in the Energy Balance - #2 by chris) - next on my list is mixed-mode. Before that, I just have one final reporting conundrum:
My energy model clearly runs with All of the HVAC Heat/Cool / DOAS / All-air systems.
However, the Room energy model extract widget does not seem to be behaving as I would expect (so no monthly heating and cooling graph):
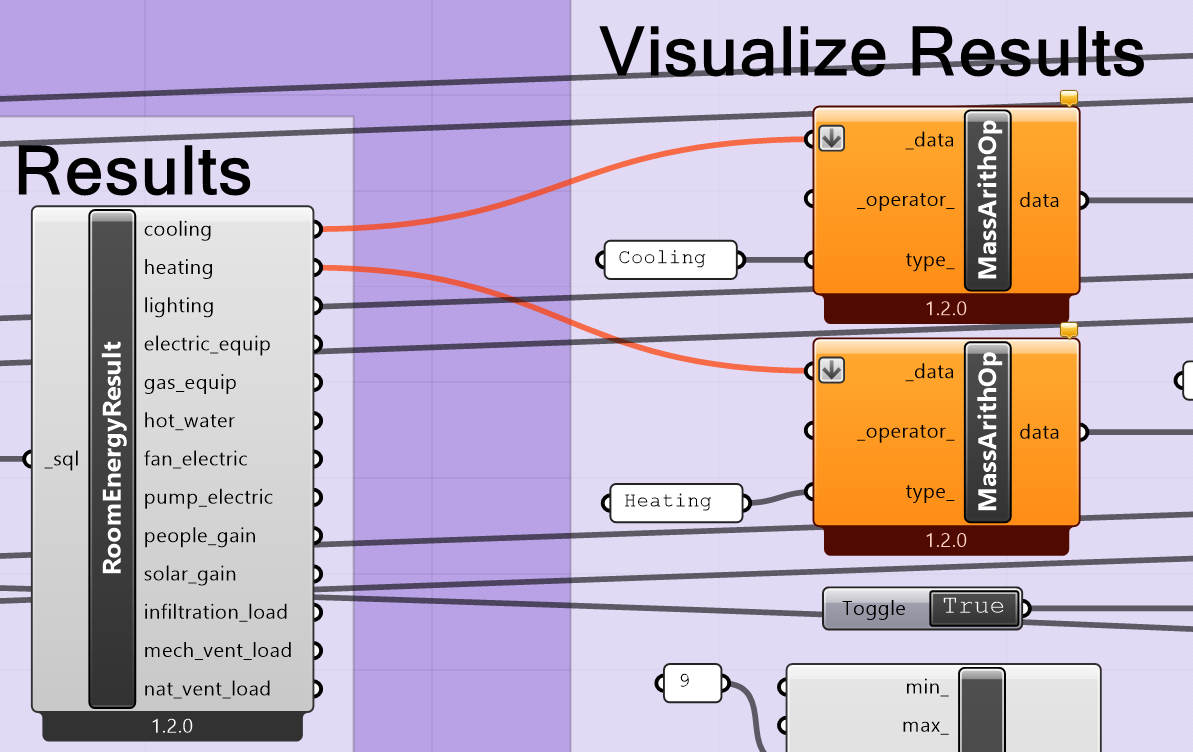
(Those red lines indicate no data)
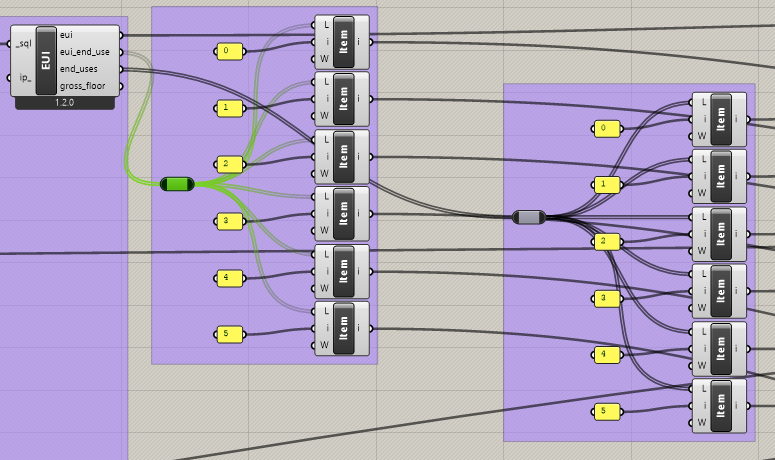
The data is clearly available in some form because I can extract the annual EUI etc:
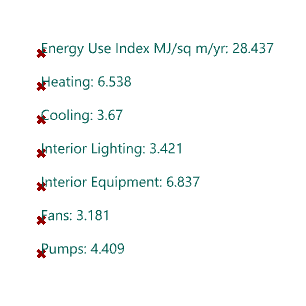
writing out this data:
I have looked at setting up to extract a custom output, but from the hundreds of options I cannot figure out a valid one.
M