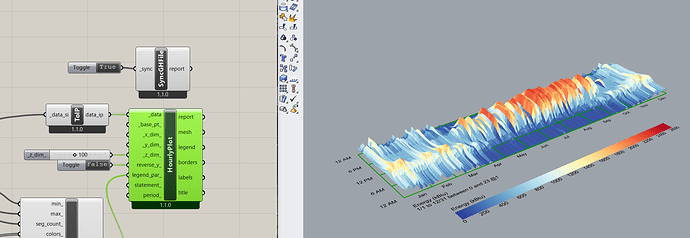
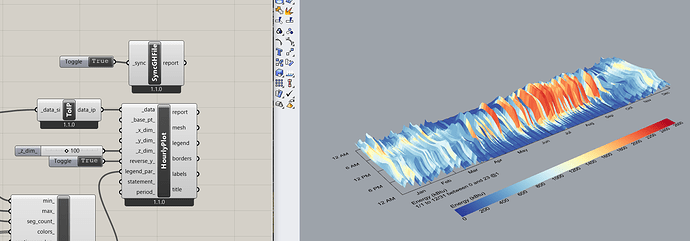
I put together an hourly plot of the total energy for a building. I’m wondering if there is something that I am doing wrong with my input or if this is a small bug. When I set reverse_y_ to true, the color values and axes change, but the z-dimension of the plot does not. Am I using this correctly?
Thanks!

