I’m texting the new HB Peak Loads component, it is a great and fast component. But the loads doesn’t stack. Not sure where the issue is, as I have just replicated the “shoe box peak loads” sample, just using my own texting building.
I have the same problem. I also tried to apply this quick analysis to a small building but it doesn’t work. Both samples of peak loads and annual loads comprise a single space analysis, maybe that is the key: this analysis is supposed to be used for shoeboxes only.
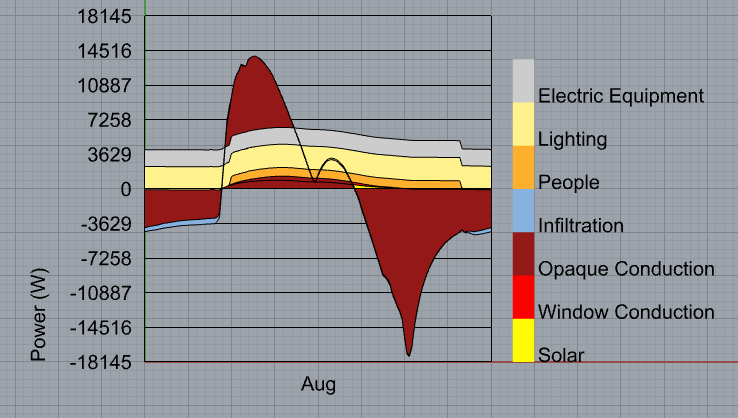
They are stacked and your screenshot is clear to me, @Barbarur . It’s just that the opaque condition is more negative (taking heat away from the space) than it is positive (adding heat to the space) so it get’s stacked to the negative side of the chart instead of the positive one. I might recommend modeling spaces with windows and then you’ll see less of the opaque conduction dominating the load balance.
And the Peak Loads component is definitely designed for multi-room simulation, @pmcmm . The only reason why I made the sample files with a simple shoe box is so that you can scroll through the results in real-time rather than waiting a few seconds for results
Actually, I can see that you have a very small solar term and some very small windows.
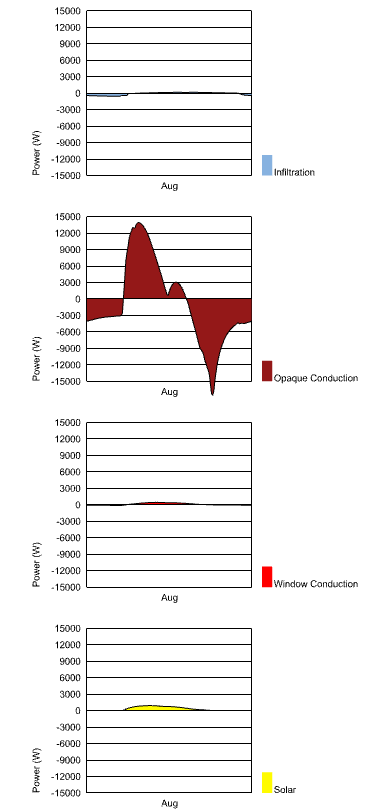
In any case, @Barbarur , I would recommend plotting individual load terms on different charts if you ever get stuck like this. It’s much clearer to see what is going on when it’s broken out like this: