Hi All,
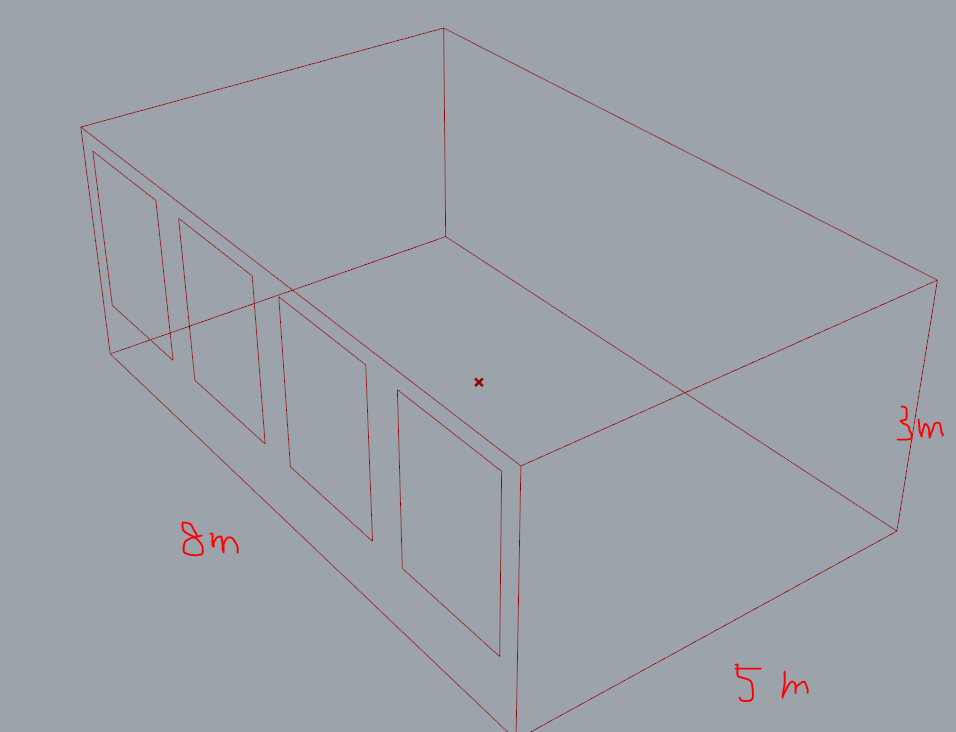
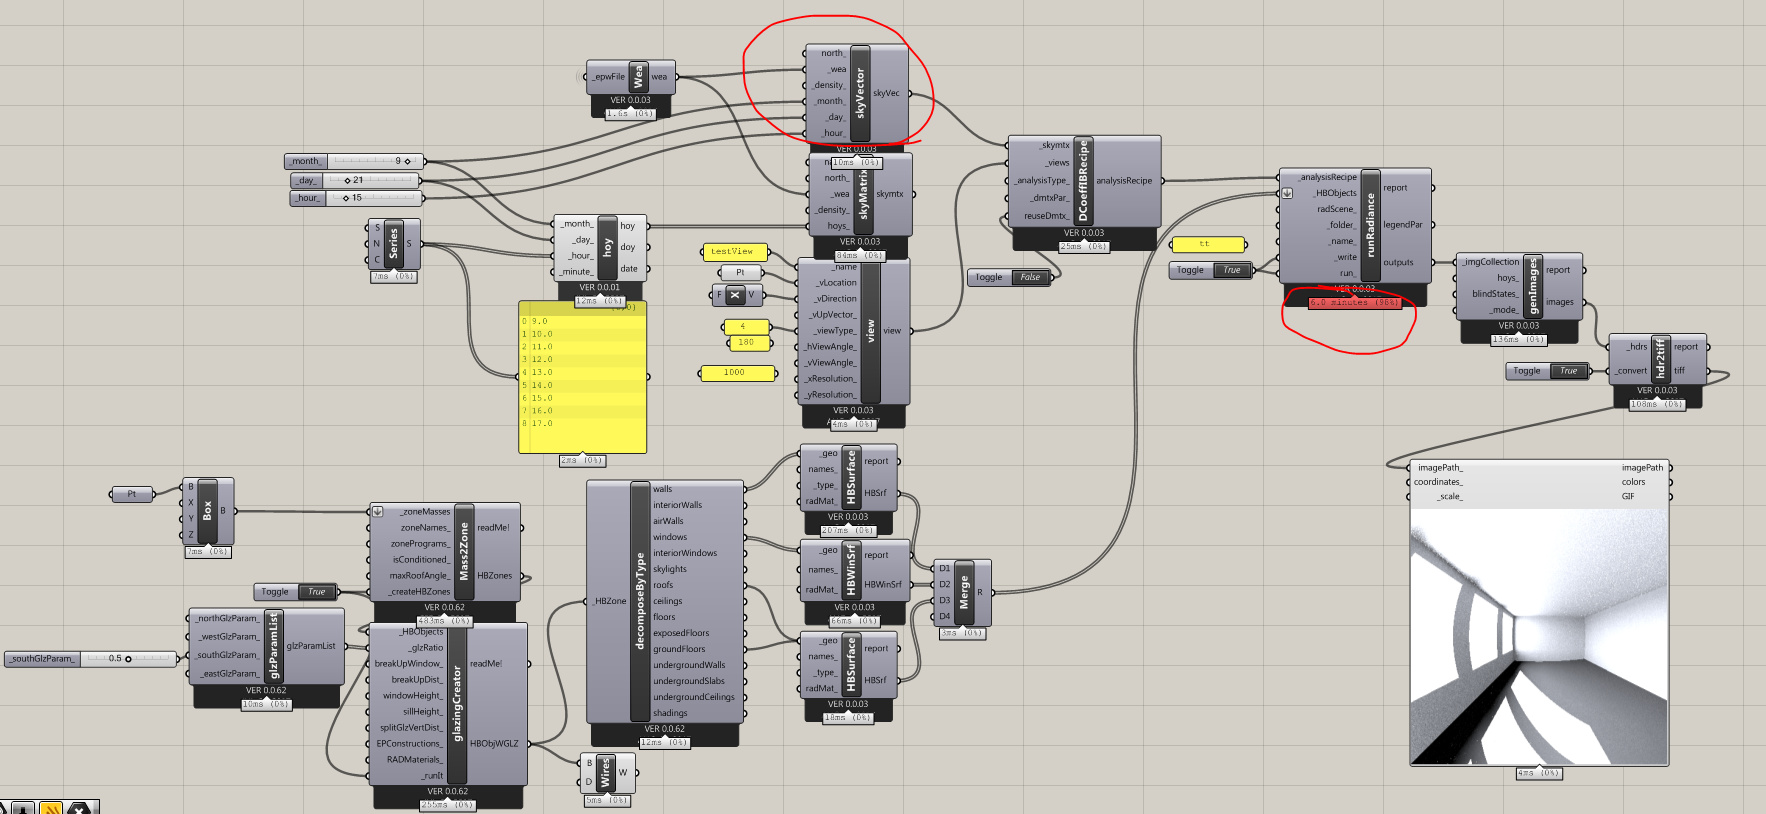
Just curious that how long does it take to run one image based daylight coefficient simulation for one single box model.
In my case, it takes 6 mins. it just doesn’t seem right.
@sarith is this normal?
Hi All,
Just curious that how long does it take to run one image based daylight coefficient simulation for one single box model.
In my case, it takes 6 mins. it just doesn’t seem right.
@sarith is this normal?
Hi @MingboPeng , should it be taking longer or lesser than 6 minutes ?! 
Do you think it’s too short or too long? Here is a “secret” link to understand how calculation parameters will work for HB[+] settings… http://www.ladybug.tools/radiance/image-parameters
Thanks @sarith, I was expecting for a model like this box room, should be no more than 1 minute.
I also found http://radsite.lbl.gov/radiance/refer/Notes/rpict_options.html this is helpful.
The ambient settings in your hyperlink especially (-ar, -aa etc) are not really relevant to rcontrib or rfluxmtx (which are what we use for annual daylighting simulations).
For the first 25 odd years of its existence, Radiance had mostly one way of handling ambient calculations - which was a combination of Monte-Carlo methods and Ambient caching. Rcontrib and rfluxmtx (which essentially is a wrapper for rcontrib) employ pure Monte-Carlo raytracing. This is why you will never see (or shouldn’t see) splotchy renderings that we typically see with conventional Radiance. A poor quality HB[+] rendering will be grainy and not splotchy. Here are a couple of examples:
Poor Quality Conventional Radiance Image with Rpict (which is what Honeybee runs):
Poor Quality Rcontrib/Rfluxmtx image (which is what Honeybee[+] runs):
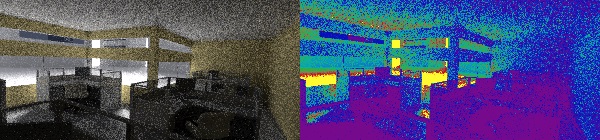
Actually calculation settings in HB[+] are a lot simpler than conventional Radiance, you just need to keep cranking up -ad (and correspondingly decrease -lw) till you get convergence.
I think we should run a similar parametric run for rpict and put it up on the page at some point. The main questions if which parameters are we going to be really interested in. We may end up with a parallel coordinate chart and a brute force between all the possibilities.
Running a parametric analysis for rpict - one that is broadly useful and indicative anyway - isn’t that simple. With rcontrib/rfluxmtx we specify what the sources of radiation are upfront (through #@rfluxmtx in rfluxmtx and bin numbers and modifier files in rcontrib). This also brings up one of the disadvantages of the rcontrib method, wherein we can’t combine daylighting and electric lighting (without making everything very complicated).
Anyway, if you manage to do it, I will buy you coffee next time we meet  !
!
Haha, Mostapha doesn’t drink coffee. I will try to do this parametric analysis.
Do you think the following parameters and values for rpict makes sense to you?
-aa: 0.25, 0.2, 0.1
-ab: 0, 1, 2 ,3, 4
-ad: 512, 2048, 4096
-ar: 16, 64, 128
-as: 128,2018, 4096
Let me know your comments.
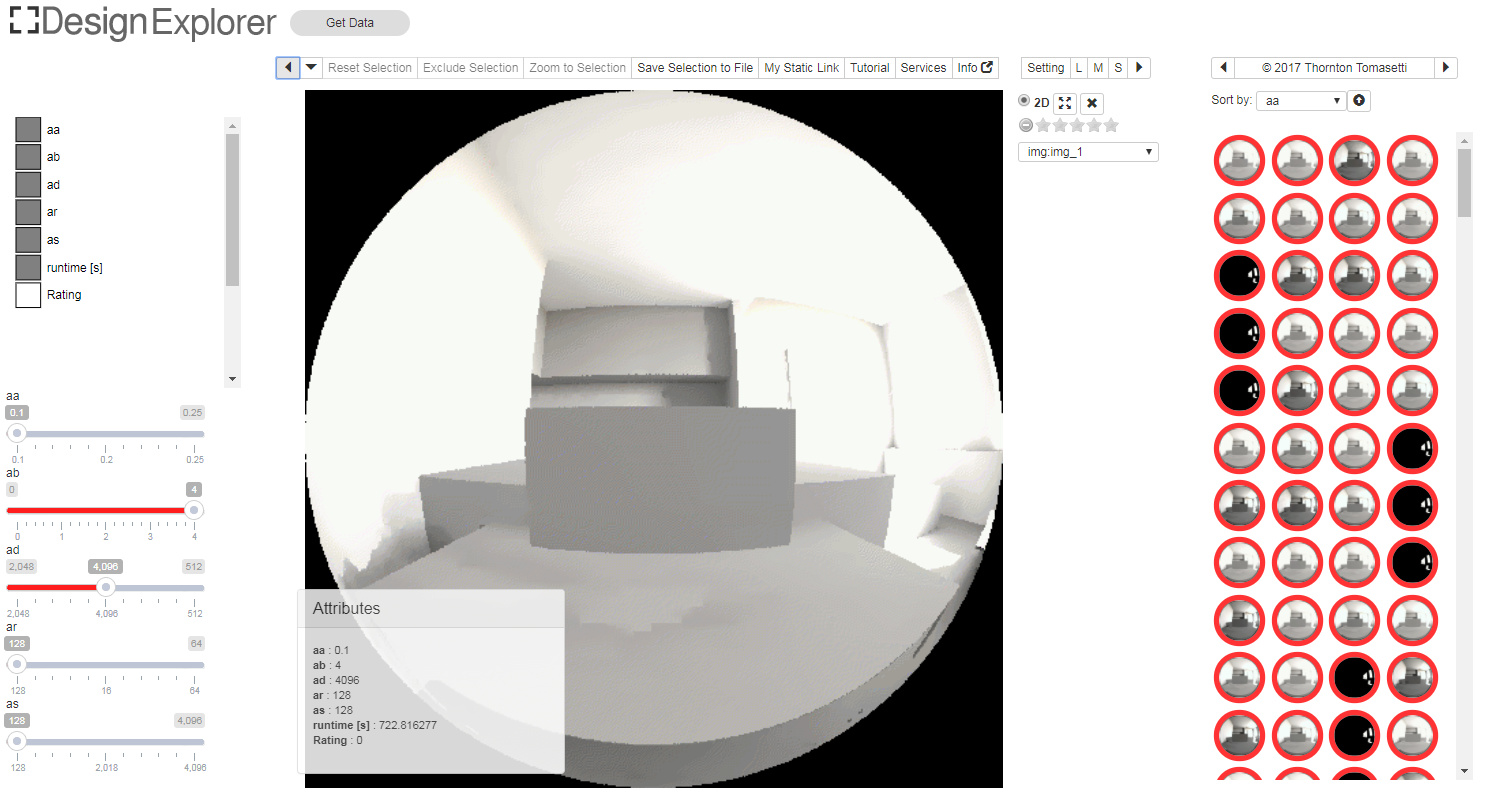
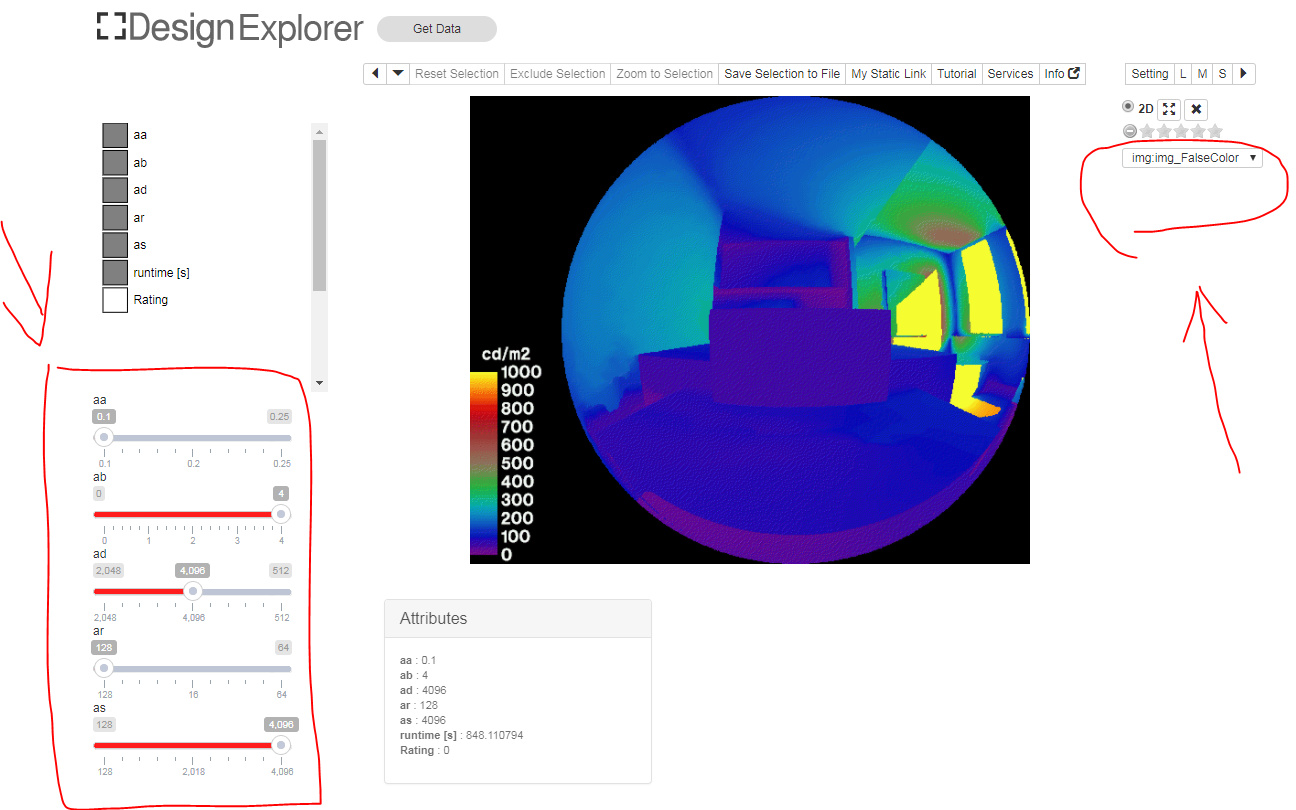
Here are results:
https://tt-acm.github.io/DesignExplorer/?ID=KeF5zn
Thanks,
MIngbo
@MingboPeng The use of design explorer for this study is brilliant ! One of the reasons why I chose two different models for the examples in http://www.ladybug.tools/radiance/image-parameters was to compare the effect of parameters on a simple vs complicated model. If you could do something similar, that will be great.
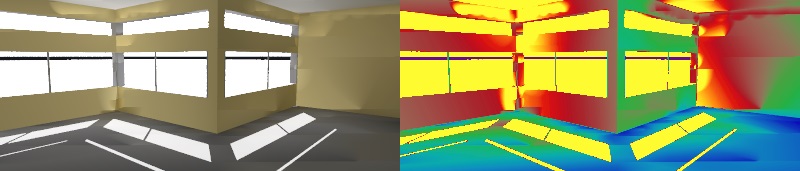
You can get rid of the overlit effect in the images with pfilt. Finally, in studies like this, falsecolor is useful because it gives us an idea of when and where convergence is likely to occur.
Looks great @MingboPeng! What if we use the same models that is used for daylight coefficient studies? I like the design explorer visualization but I think a grid based visualization based on 3 parameters is more helpful for visualizing the results for these cases.
@mostapha @sarith, actually I was looking for the model that you used in DC study. that will be great if you can share that to me.
There are falsecolor results in this study.
One thing that I found the Design Explorer is useful is using the “slider” at left. It is very clear to see the effects of each parameter.
I am just using the DesignExplorer to check all results. I will send them all to you if you want to layout them in a grid.
You can find them in this repository:
Sounds good! Both can be helpful. I love the DesignExplorer visualization but I also want to have all the images next to each other which makes it easier for quick comparison.
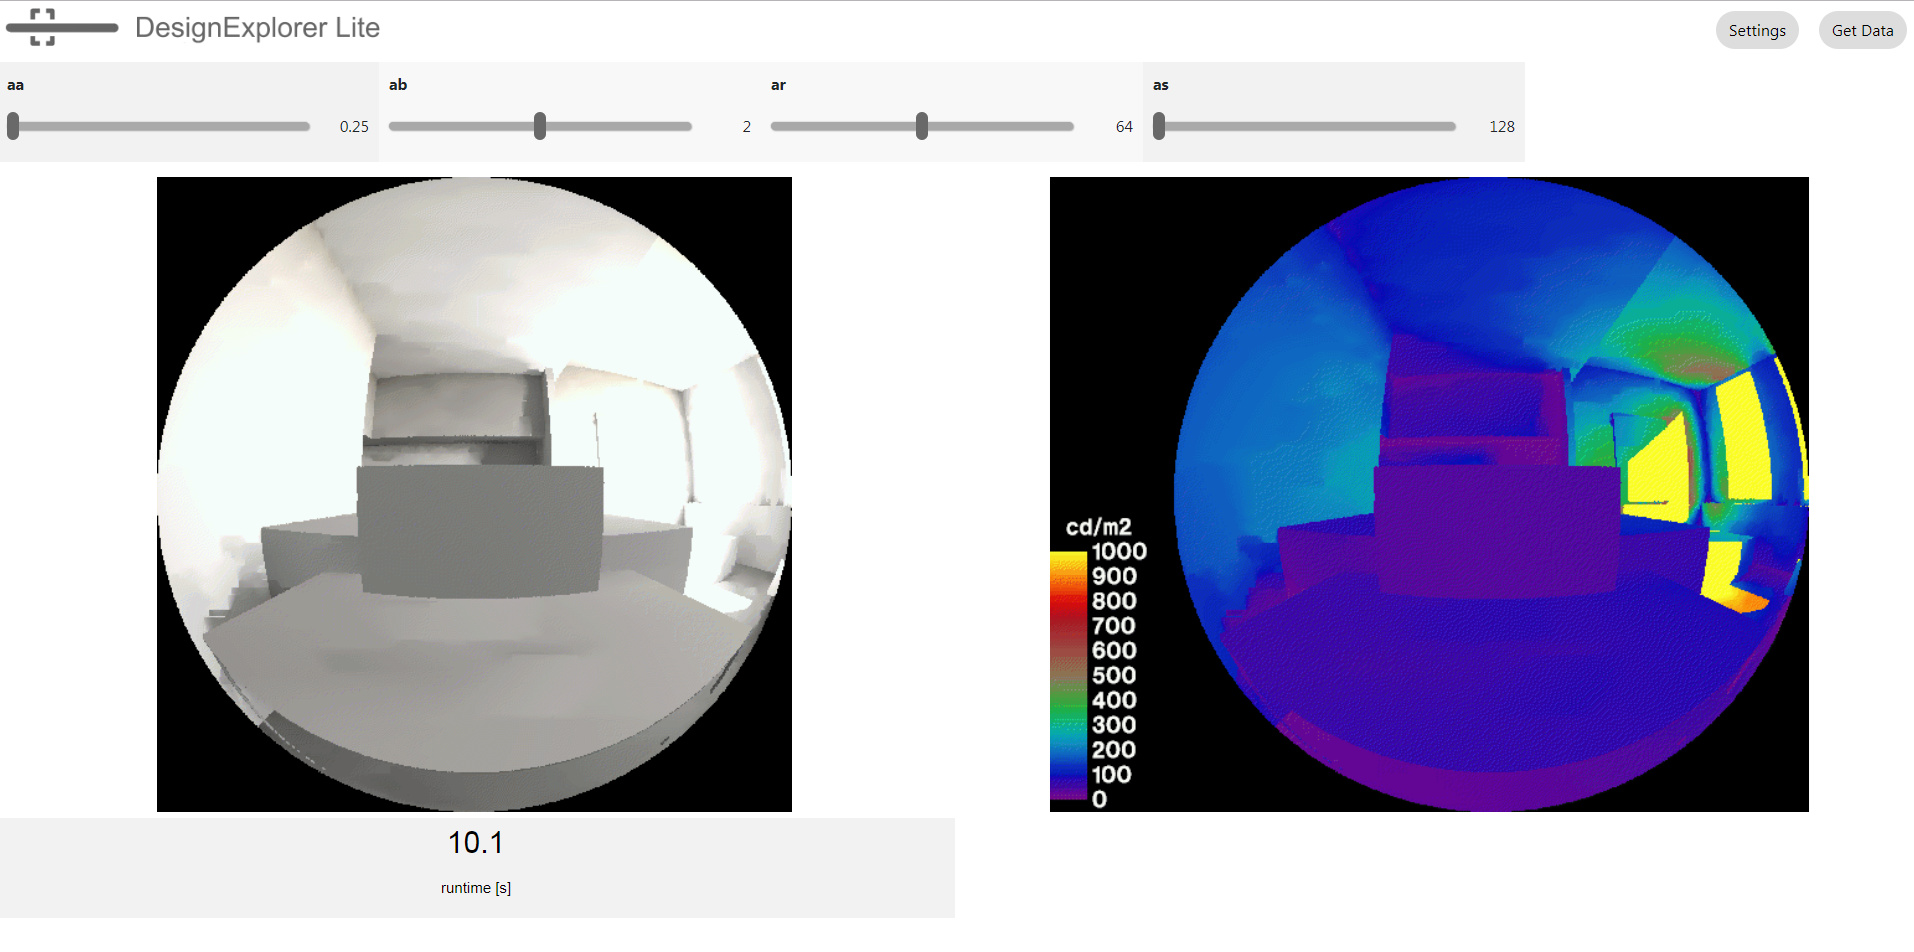
Visualizing the same data in Design Explorer Lite @chris