I am getting unexpected results for HB UTCI, and I would appreciate if you can help me understand them.
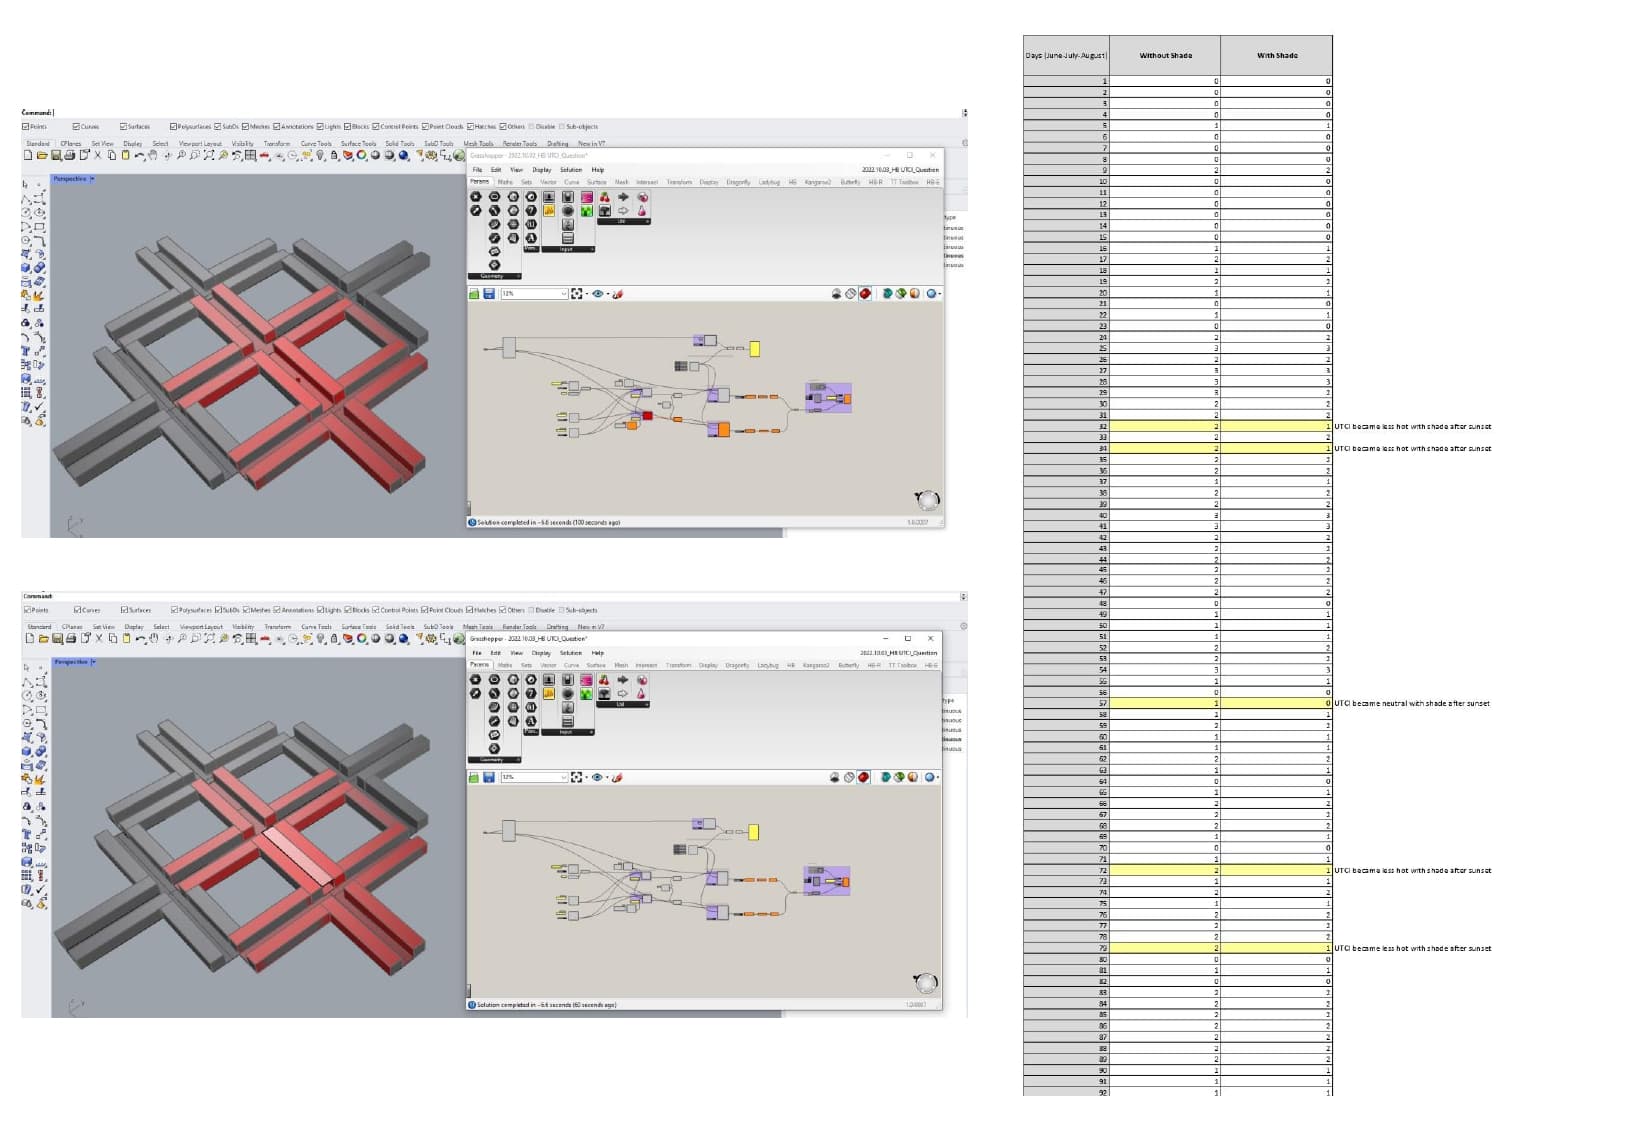
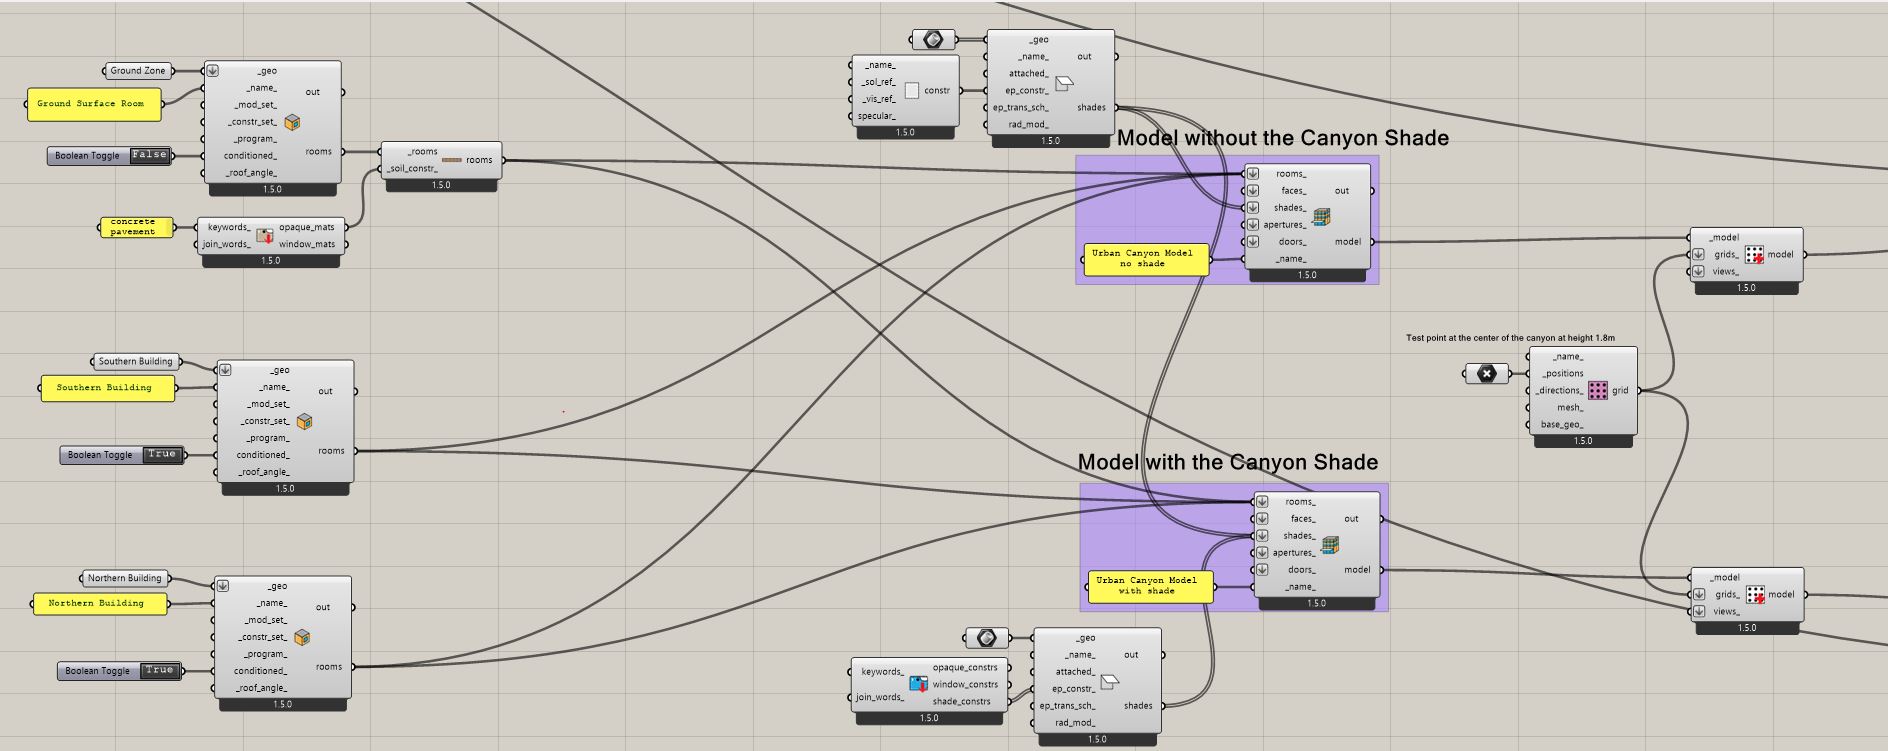
So, as can be seen in the screenshots provided. I am calculating HB UTCI for a single point in the middle of an urban canyon, once without shade above the canyon, and once with a shade component.
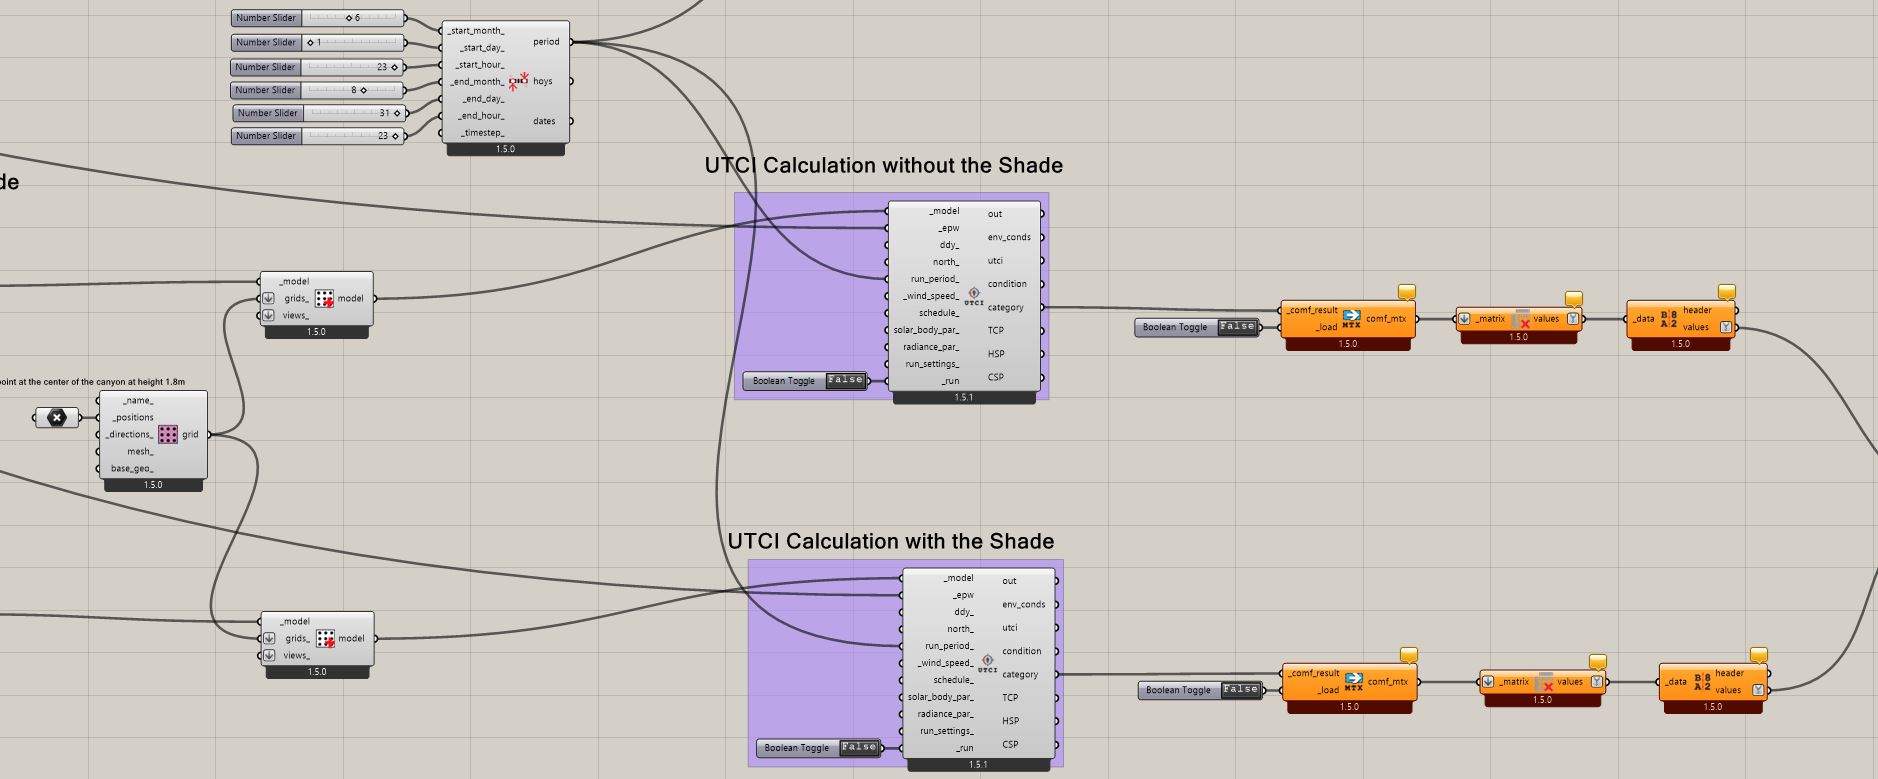
I am studying what difference the shade would make in the hours after the sunset. So I chose the hour 23:00 for the comparison, for 3 months of the summer (June, July and August).
I was expecting that the shade would increase the hot discomfort, because it will be blocking the longwave heat radiation back to the sky at night. However, the result showed either the UTCI category remaining the same, or actually improving to be cooler at night with the shade present.
Can you please help me understand how this happened?
N.B: I tried uploading the grasshopper file, but I cannot seem to be allowed because I am still a new user.
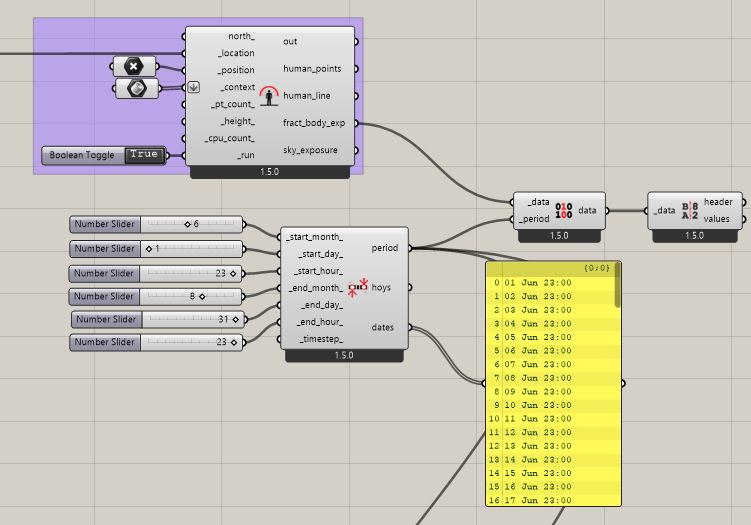
Hi @regwan, thanks for the more detailed screenshots. Looking at your analysis period you’re simulating from 2300 on June 1st to 2300 August 31st, ie every single hour in that period, not just 2300 each day.
You’ll need to do some post processing to get 2300 from each day that you’ve simulated (assuming you haven’t already).
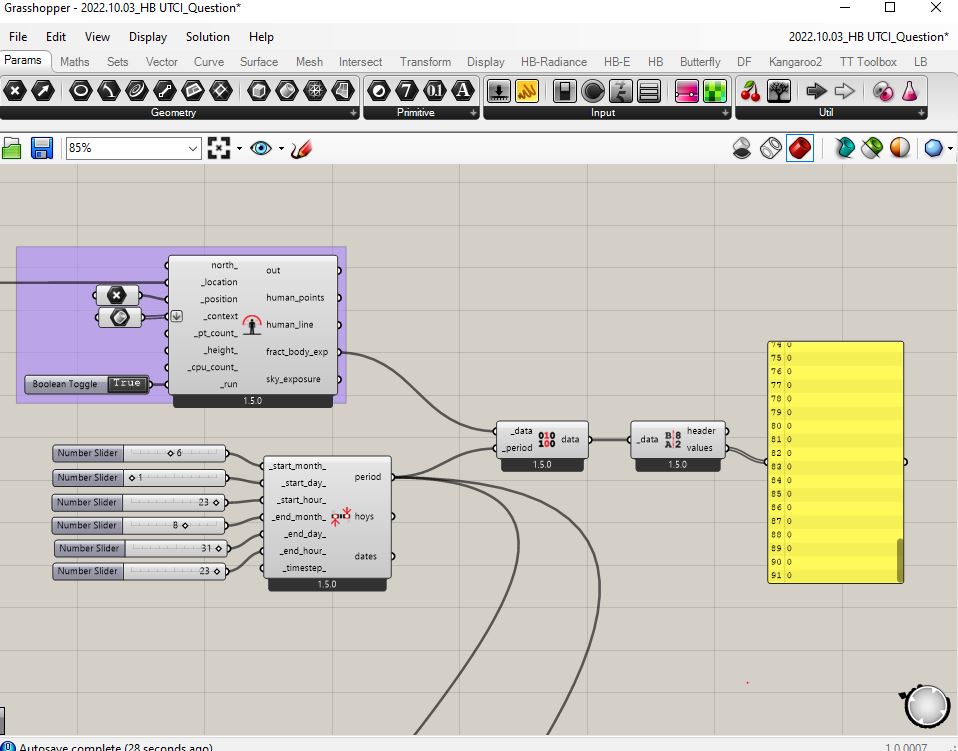
I thought the same thing regarding the calculation of all the hours inbetween, however, I got 92 results only for the solar exposure when I input this same period. So I thought I was mistaken.
Hi @regwan, I might be wrong but I’m fairly confident that it will be every single hour in that period.
If you attach a panel to the dates output of you analysis period component it should tell you what hours are being analysed. I’m also pretty confident that the UTCI map component only takes consecutive hours as an input, and wouldn’t be able to do disjoint hours (due to the energy plus simulation it carries out to get surface temperatures).
I put a panel for the date output, and seems it is just for 1 hour (23:00) each day. This is so weird, because I thought it should be like you are saying.
Hi @charlie.brooker, it is okay. Now it is confirmed, I was not 100% sure before. So thank you.
I am using the weather climate for Cairo (Cairo’s international Airport). I’m not sure if you will find it online, i have the file on the computer. I don’t know if I can upload it tho. I’m away today from the computer on some other task. I will try to send it when I get home.
I also applied the UWG adjustments to the epw file to account for the UHI effect.
However, this shouldn’t matter tho, because I am using the exact same parameters for (shade) and (without shade).
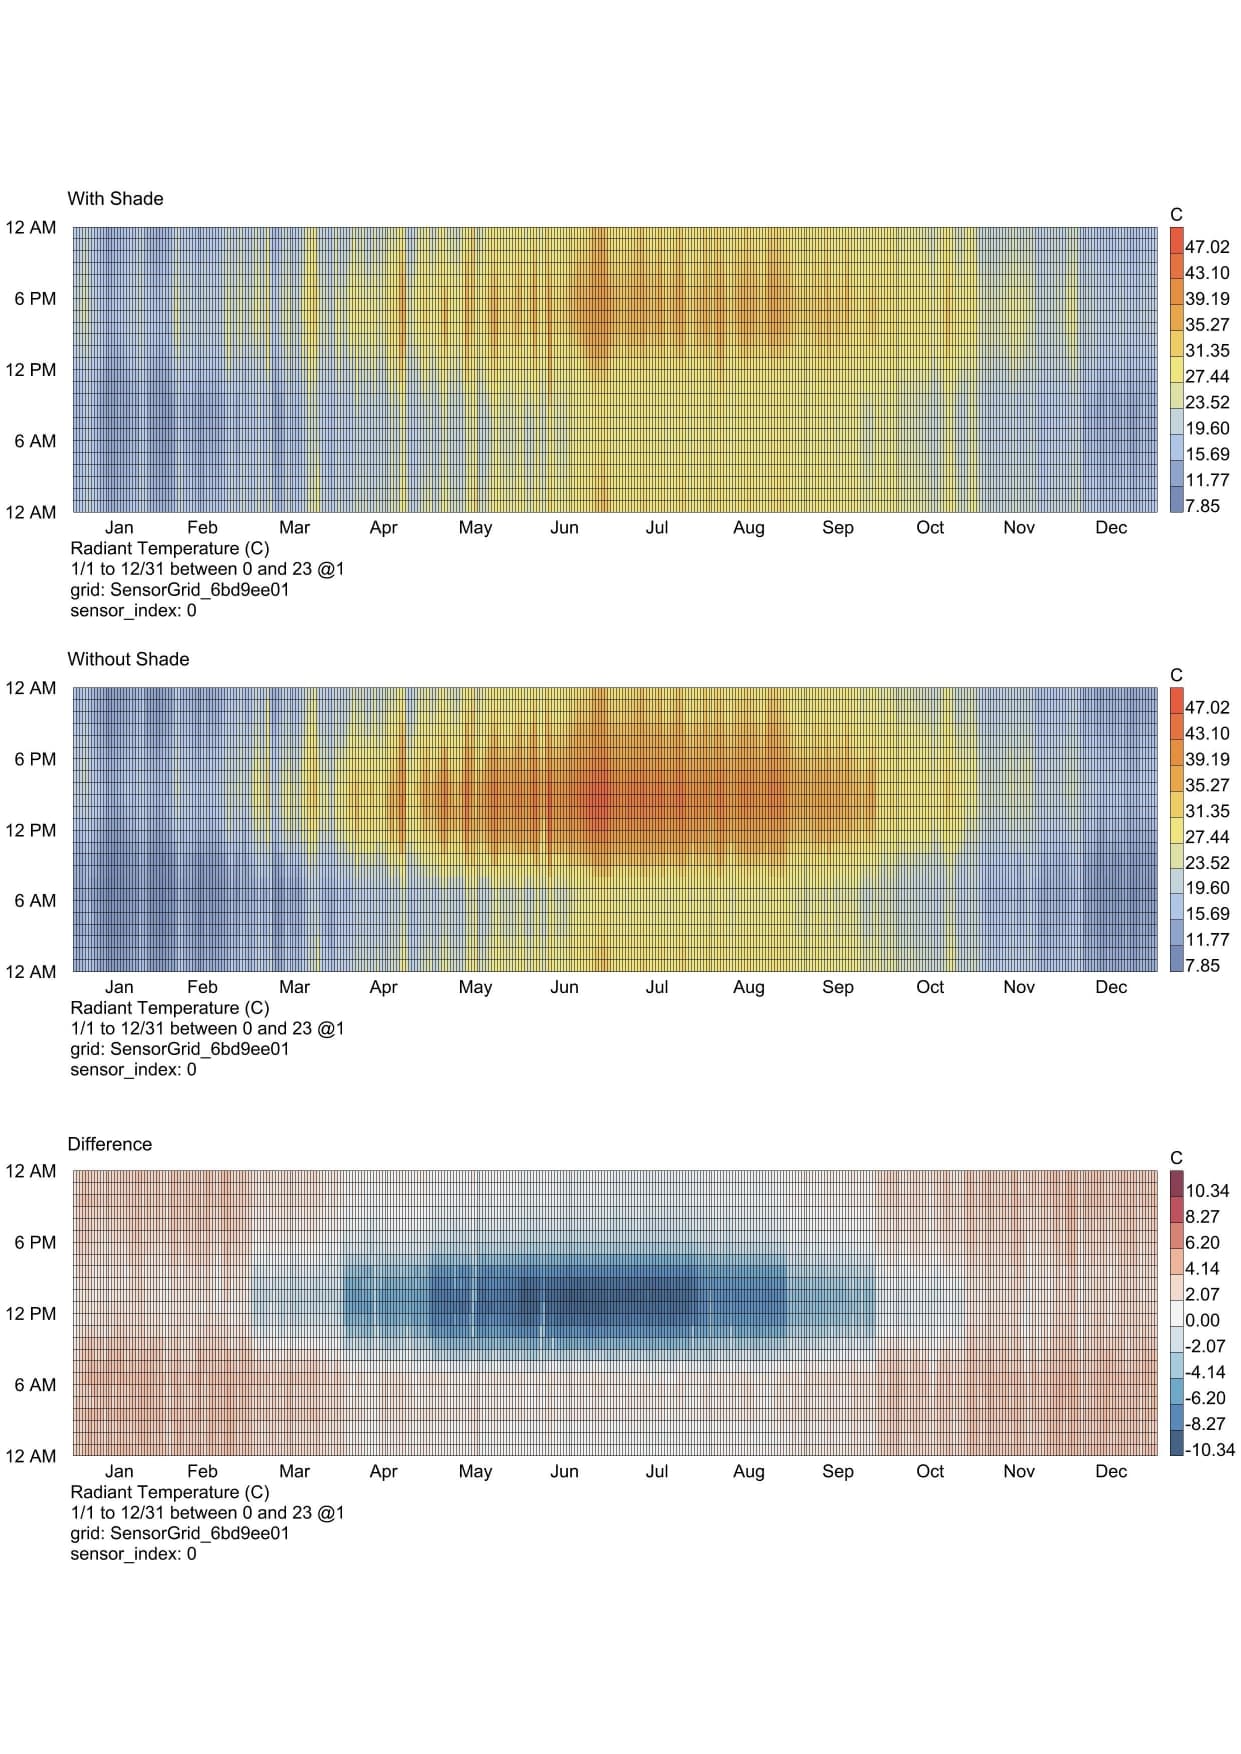
I’ve put together a simple sample script for a shaded and unshaded urban canyon. There’s a fair amount of simplification of the model, but the principles should be correct.
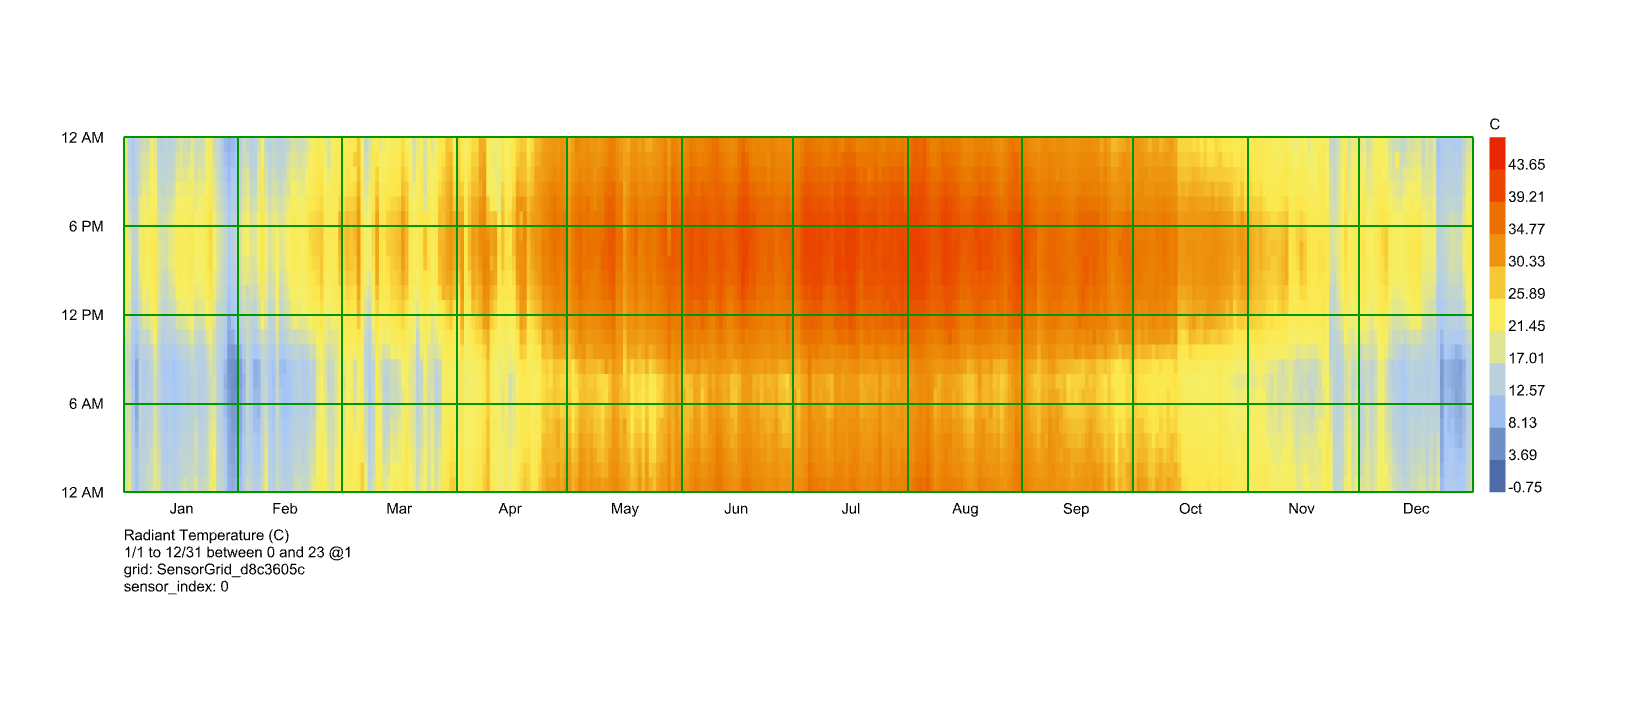
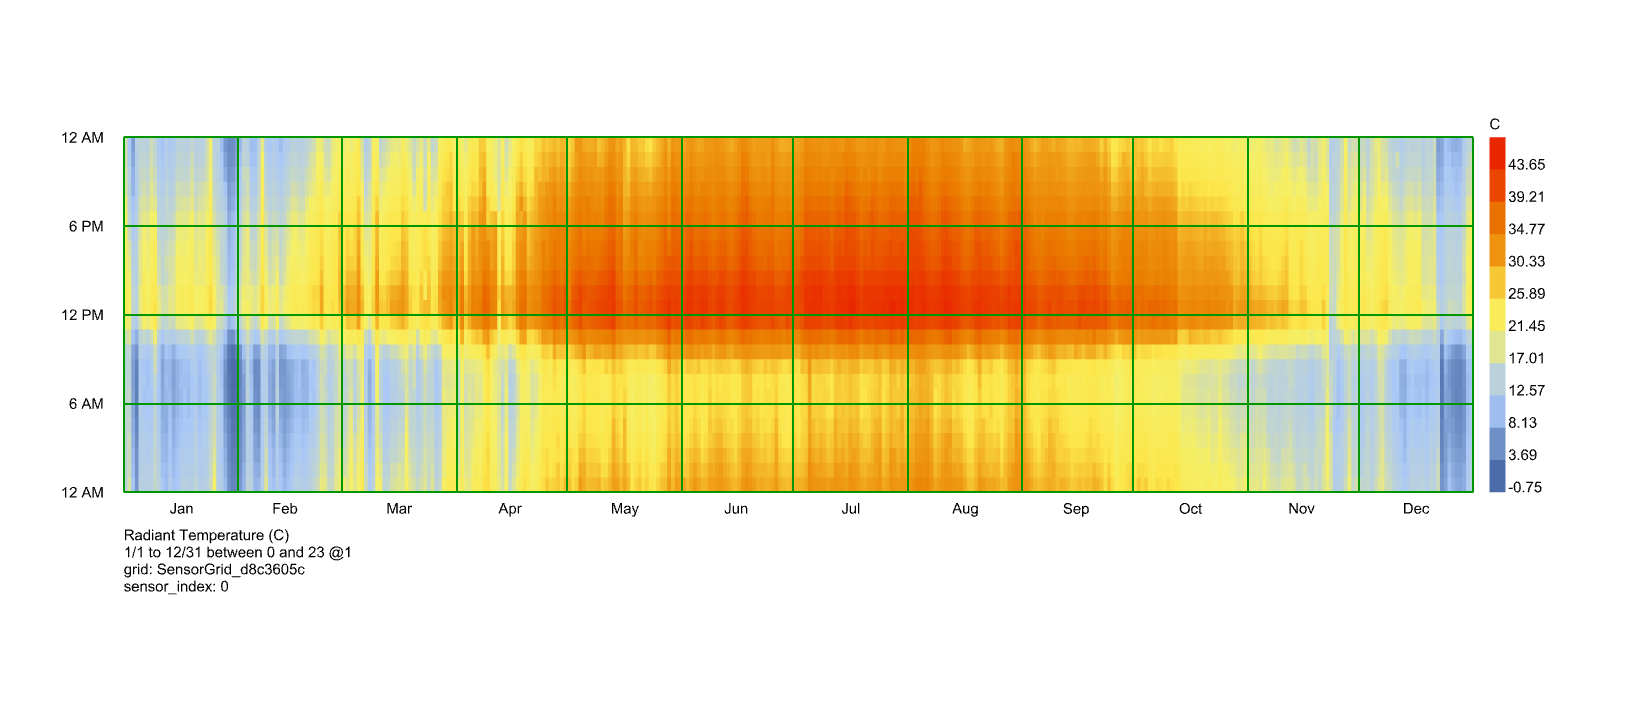
You can see the difference in the Longwave MRT plots below. As expected the Longwave MRT is lower overnight for the unshaded condition.
Unfortunately, I am still unable to attach any files. Only photos and 1 per post.
I took a look at the file you sent. It makes sense to have the Longwave MRT reduced with no shade present.
But I still don’t understand why I got lower UTCI values with the shade at night. It contradicts with the expectations.
The only thing as a significant difference between my script and yours, is that I put the buildings around the canyon as “Rooms”, as well as “Shades”. I don’t know if that would make a difference tho.
I appreciate your help. Thank you for taking the time to do this work.
Can you copy the plots I’ve produced in your own script and share images of those?
ie the longwave MRT plots for the shaded and unshaded condition
Personally I prefer to model adjacent buildings as shades rather than rooms, as rooms will process all of the internal temperatures, whereas for an external comfort study we’re not interested in that information. Modelling them as shades I believe will set them as having a surface temperature = air temperature, which is usually a reasonable approximation.
I am working on increasing the trust level now. Thanks
I am not sure about the approximation of the surface temperatures to be equal to air temperature, otherwise, wouldn’t it be reasonable to calculate the UTCI through ladybug? Because I am doing this work as a part of a PhD thesis, I try to show both results and mention whether or not there was a significant difference that was worth going the more complex way.
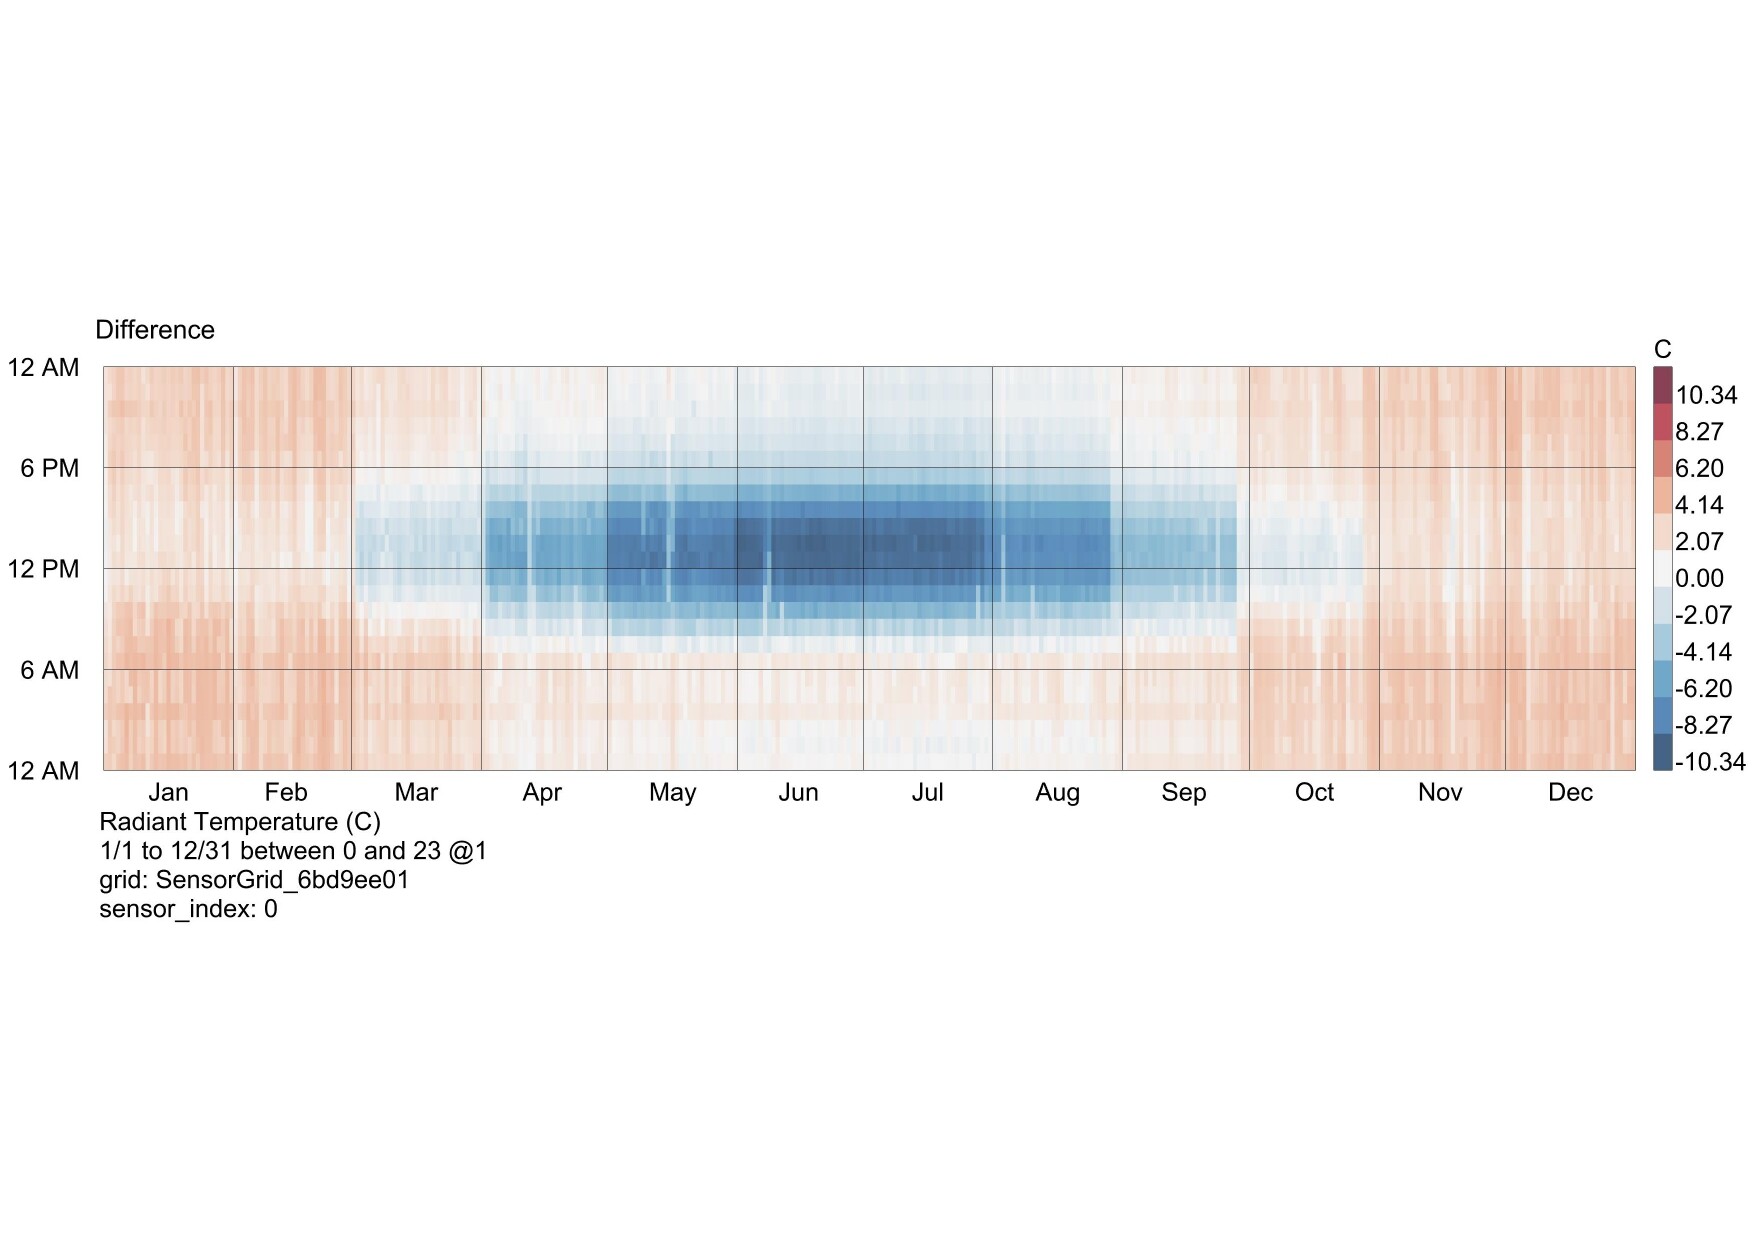
Interesting - for your set up it looks like there’s close to 0 difference in Longwave MRT at 11pm between the shaded and unshaded conditions.
The orientation of the urban canyon will have an effect, my model was based on N-S canyon, so exposure to sun was limited to a short period around midday.
From your earlier screenshot it looks like you’re assessing an E-W canyon, so you’ll get much longer period of solar exposure. Your ground material will probably be getting hotter due to longer solar exposure, and as it’s exposed later into the day it may still be retaining a lot of that heat into the night (from your plot it looks like the unshaded condition only really has a lower longwave MRT from around 3-6am).
The approximation of surface temperatures being equal to air temperature I only use for building surfaces, and I generally accept that as a minor uncertainty/error. The additional simulation time and effort in splitting up a building into smaller surfaces and accurately modelling their facade properties I don’t feel is worth it for the work I do.
What is captured by the HB version rather than LB version in my script is more accurate ground surface temperatures and thermal mass effects of that, as well as detailed analysis of human exposure to sun from the radiance aspect.
But it does not make sense to have the heat reduced at night when a shade is placed over the canyon. The UTCI results showed an improvement in the category with the shade present.
Also, Cairo should not have that much of a cloud cover? and not at all during the summer, which is the period I am testing.
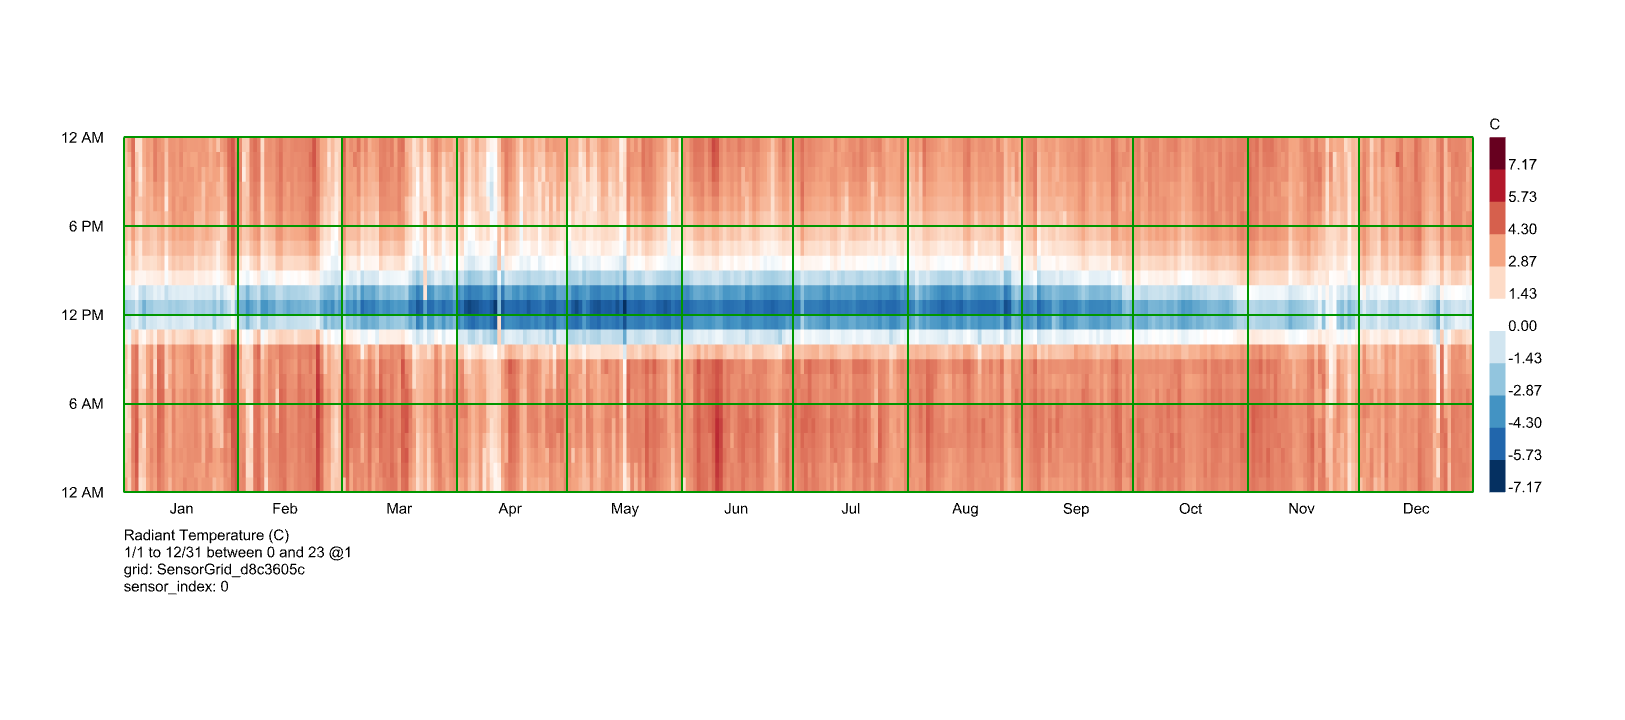
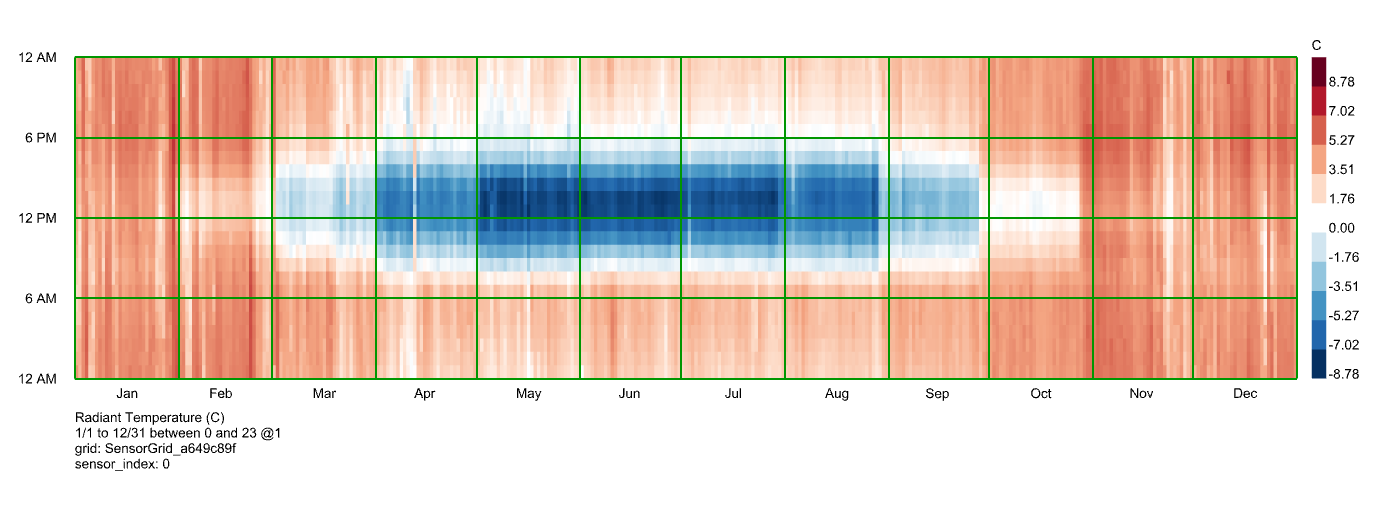
In the blue-red plots blue shows that long wave MRT is higher in the unshaded condition and red when the long wave MRT is lower in the unshaded condition (I probably should have set this up more clearly but that’s how it is atm)
So for me reading it, the unshaded condition is cooler overnight (ie when the plot shows red) but hotter when exposed to the sun (when the plot shows blue)
Yes, I read it correctly, and I think your graphs are correct.
However, in my graph (the difference one), you can see it is blue during the sun hours, but at night it is not red. I believe some are a very light shade of blue. And that is why when I calculated the UTCI categories, it showed that some actually had lower value with the shade.
Question is, how is that even possible? that having a shade during the night makes it even cooler, rather than trapping the longwave heat radiation. I cannot seem to find an explanation.
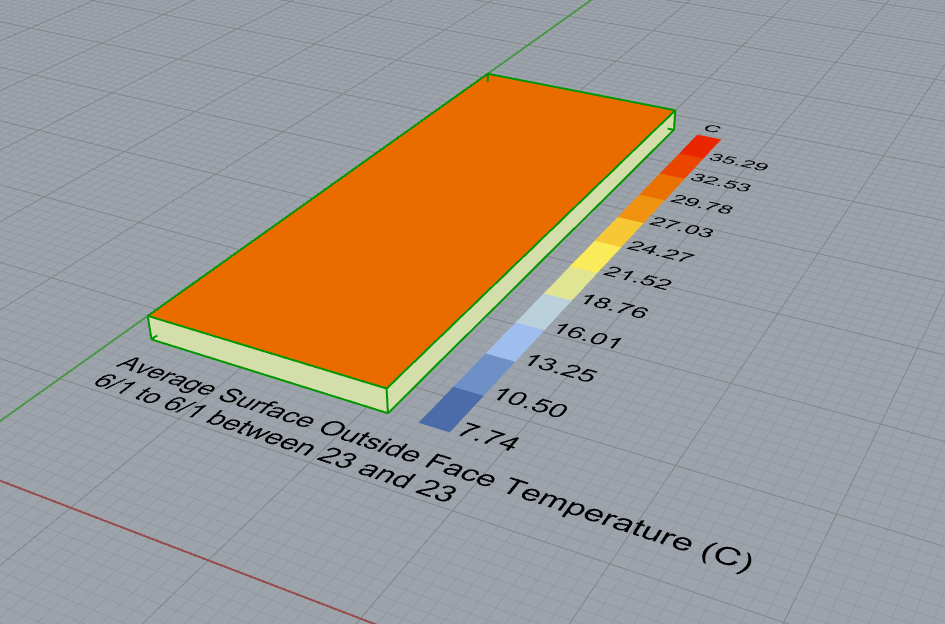
Thanks for the image, that is clearer. I’d guess that in your analysis the temperature and thermal mass of exposed surfaces in your unshaded case is resulting in higher temps than in your shaded case, and that those carry late into the evening / early morning.
To check that you’ll need to visualise your surface temperatures. I’ve added something for that in my script here: LBT_shaded_unshaded_LongwaveMRT.gh (222.0 KB)
Although I don’t feel like that fully gets to the bottom of your question. Doing some digging in the simulation folder for the UTCI calc, there is this location utci_comfort_map\radiance\longwave which shows the view factors and in the scene.mod file what I’m guessing is what each surface each view_factor relates to.
The interesting thing jumping out at me from that is that it seems like all sky is treated with the sky_glow_mod.
From the UTCIMap description
These view factors are then multiplied by the surface temperatures output by EnergyPlus to yield longwave MRT at each sensor. For outdoor sensors, each sensor’s sky view is multiplied by the EPW sky temperature to account for longwave radiant exchange with the sky. All outdoor context shades and the ground are assumed to be at the EPW air temperature unless they have been modeled as Honeybee rooms.
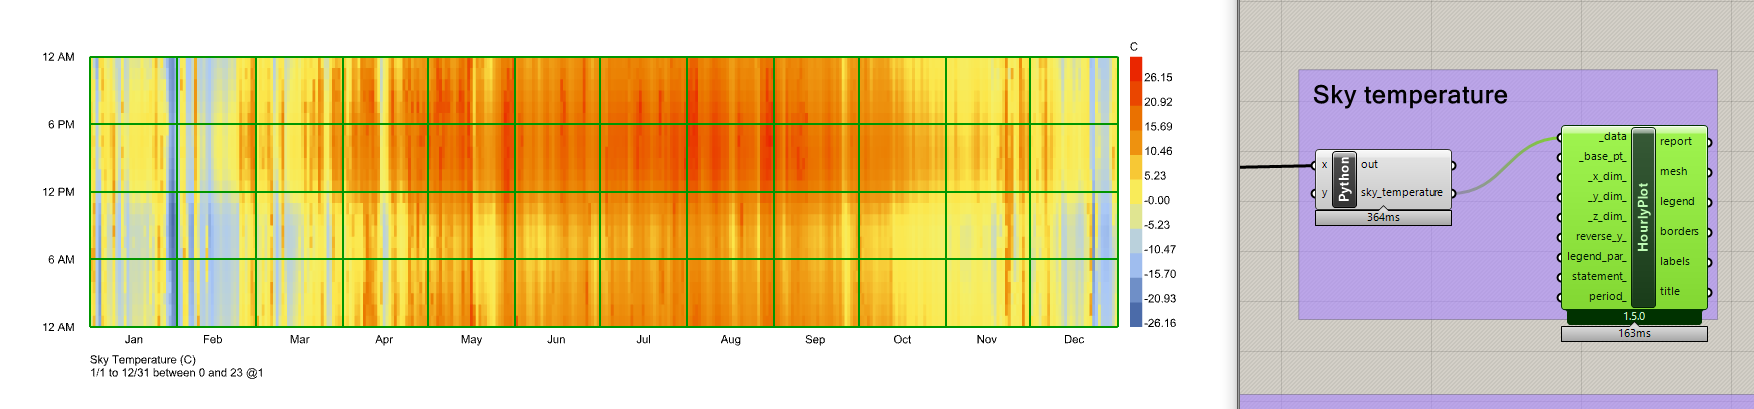
So I’ve also added into the script a ghPython component to get the sky temperature information for you. Hopefully then you have all of the factors that make up the Longwave MRT result.