Hi,
I think it’s a very simple question, but I don’t know how to solve it in a simple way.
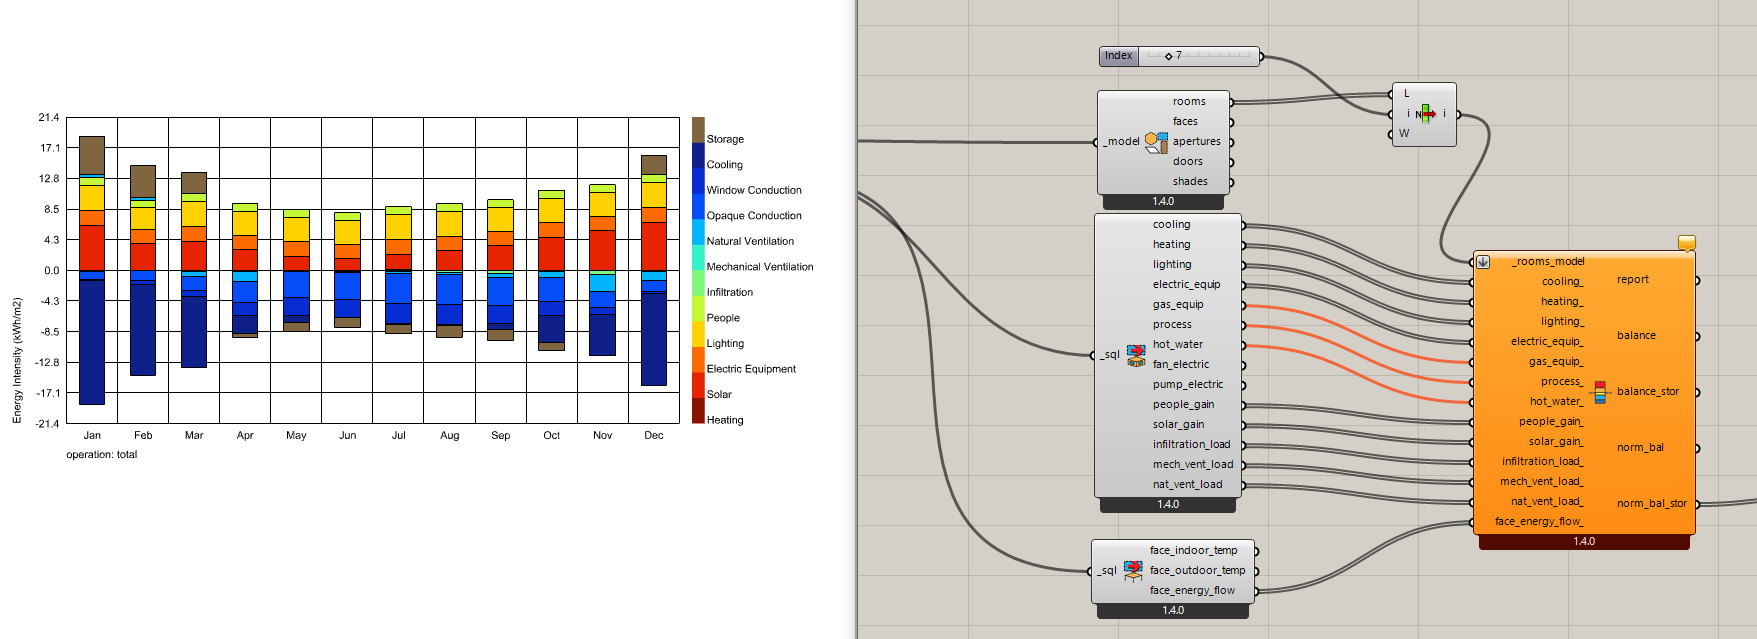
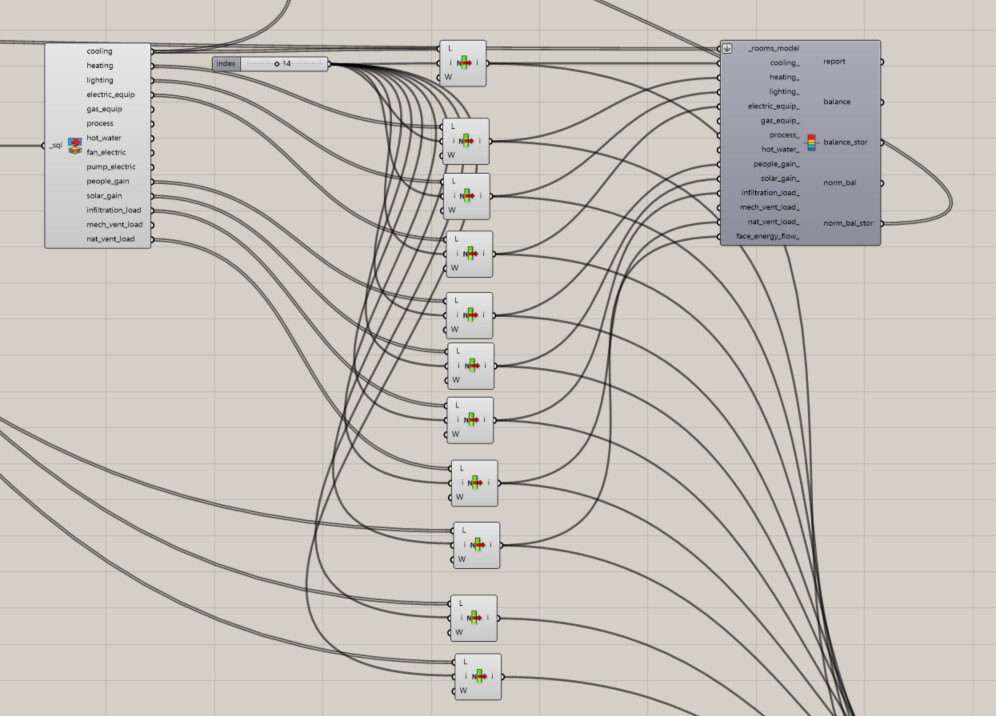
I am trying to visualize the energy balance, through the Thermal Load Balance - HB component, but I want to see the plot by zone, not of the entire building. I tried to use the List Item component and select a zone, but the problem is that the zones are not ordered in the same way. My building has several floors and they are separated into 4 zones.
For example, the way I’m doing it, I know it’s wrong because when selecting Face energy flow, it doesn’t select all the surfaces associated with the zone that I want to perform the energy balance.
consultaHoneyBee.gh (709.7 KB)
Maybe someone can give me some advice on this doubt.
Thank you very much!
Pascual.