Hi @Chris,
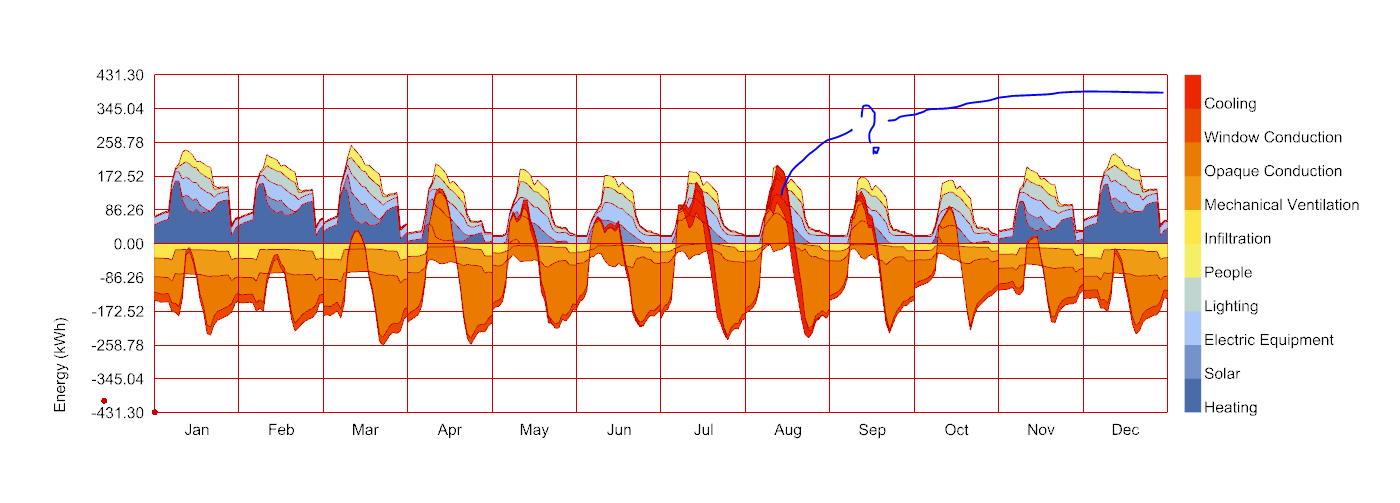
I wanted to show a stacked hourly energy balance, but I think there is something is not working as it should be working. Results are partly stacked but also partly overlapping.
Hi @Chris,
I wanted to show a stacked hourly energy balance, but I think there is something is not working as it should be working. Results are partly stacked but also partly overlapping.
Hi @Erikbeeren ,
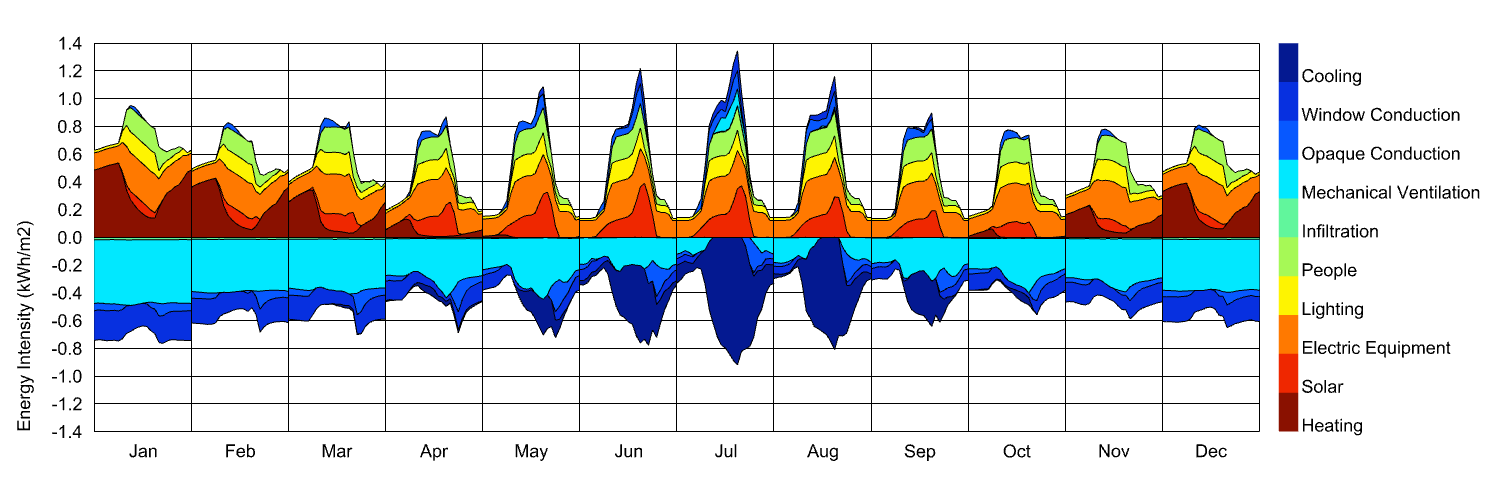
This is a visualization issue and I don’t know if there’s a great solution for it since it’s somewhat a limitation of this style of visualization. What’s happening is that the cooling value is, indeed, negative and is being added to the bottom side of the Window Conduction term. However, the window and opaque conduction terms undergo a big swing from being positive to negative over the course of the typical day in July and August. So, in the mornings, this “positive-ness” lifts up the bottom side of the term all of the way into the positive side of the axis.
I should just bite the bullet and try to find a better way do deal with these terms that swing between positive and negative. I opened an issue for it and I’ll try to see if I can implement a change soon:
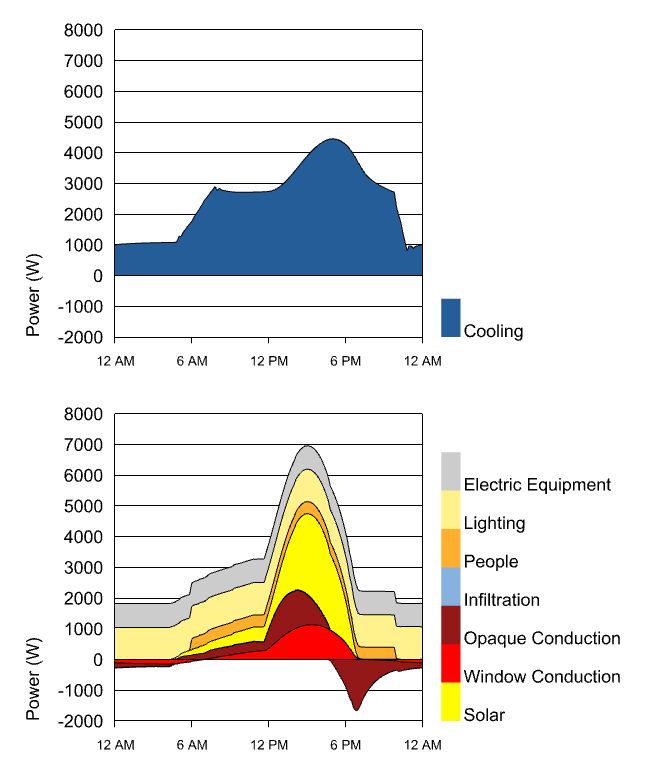
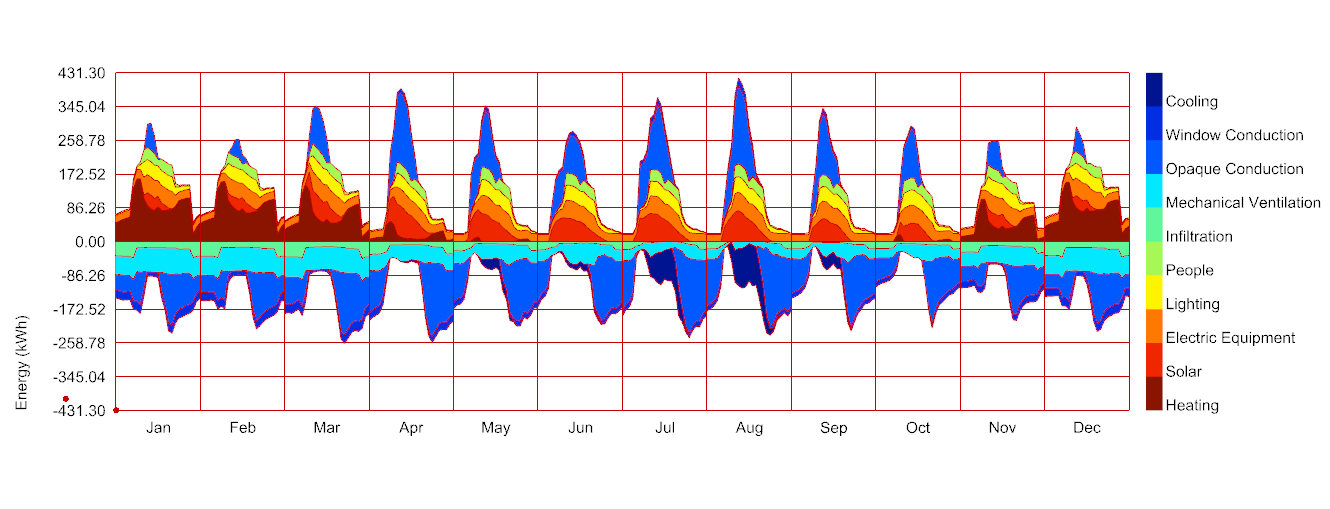
I was able to implement a better way to stack the data like this. Now, the terms that swing between positive and negative values will have their different +/- values stacked separately to the top and bottom of the chart. So there are no more weird overlaps and this gives you a sense of what things will look like:
As you can see, I also implemented an option to label the X-axis with the time of day instead of the month, which should be helpful for some of these cases where we plot hourly data.
The updates are available with the LB Versioner if you want to try them out, @Erikbeeren .
Hi @chris,
I updated LBT with the versioner, restarted Rhino, synchronised the grasshopper file, but I do not see much difference. The results are exactly the same. Probably something somewhere went wrong.
Thanks for point this out, @Erikbeeren . There was a hiccup in our CI system that was preventing the updates from getting pushed out. I just fixed it here so you should now be able to get the fix on your end with the Versioner.
Hi @chris,
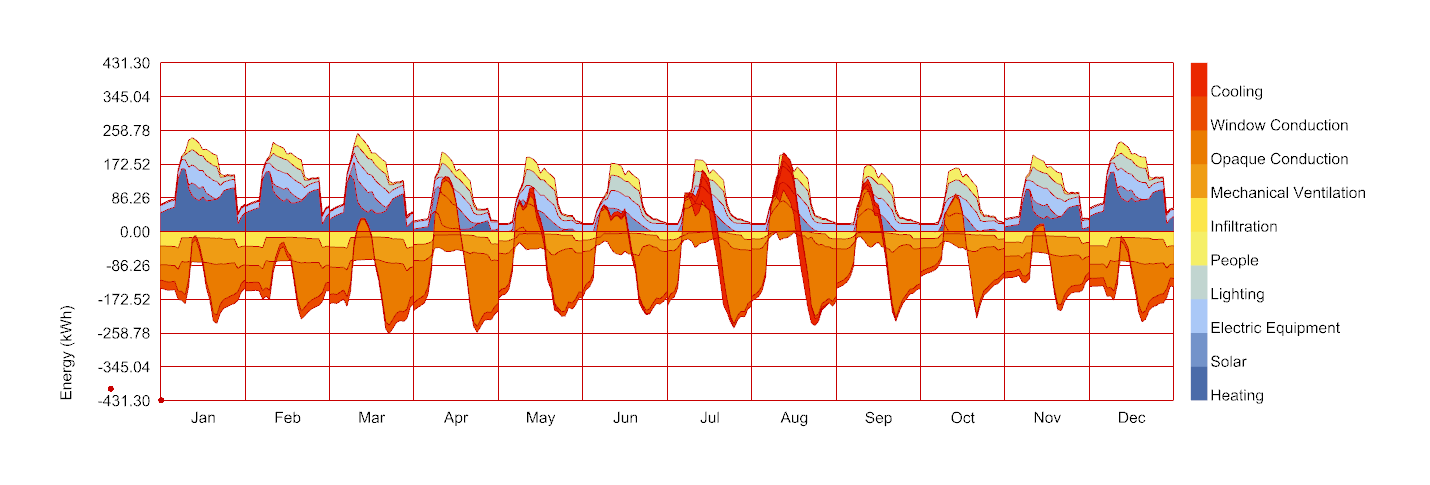
Smething has changed now but I do not think it has become much better. The stacking is somehow not doen corectly.
I guess it is a difficult one with a lot of values changing from positiv to negativ.
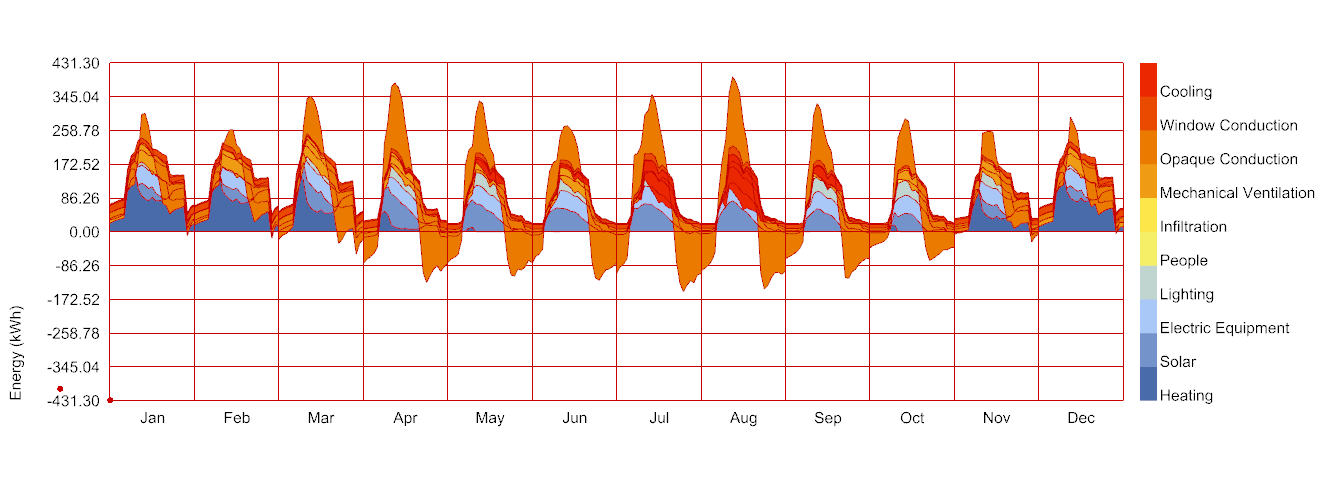
Thanks for letting me know @Erikbeeren . It seems that I should have tested the new code on more cases. I just pushed a fix:
And I verified that it is working correctly with hourly energy balances:
You should be able to get the fix on your end with the LB Versioner in an hour or so.