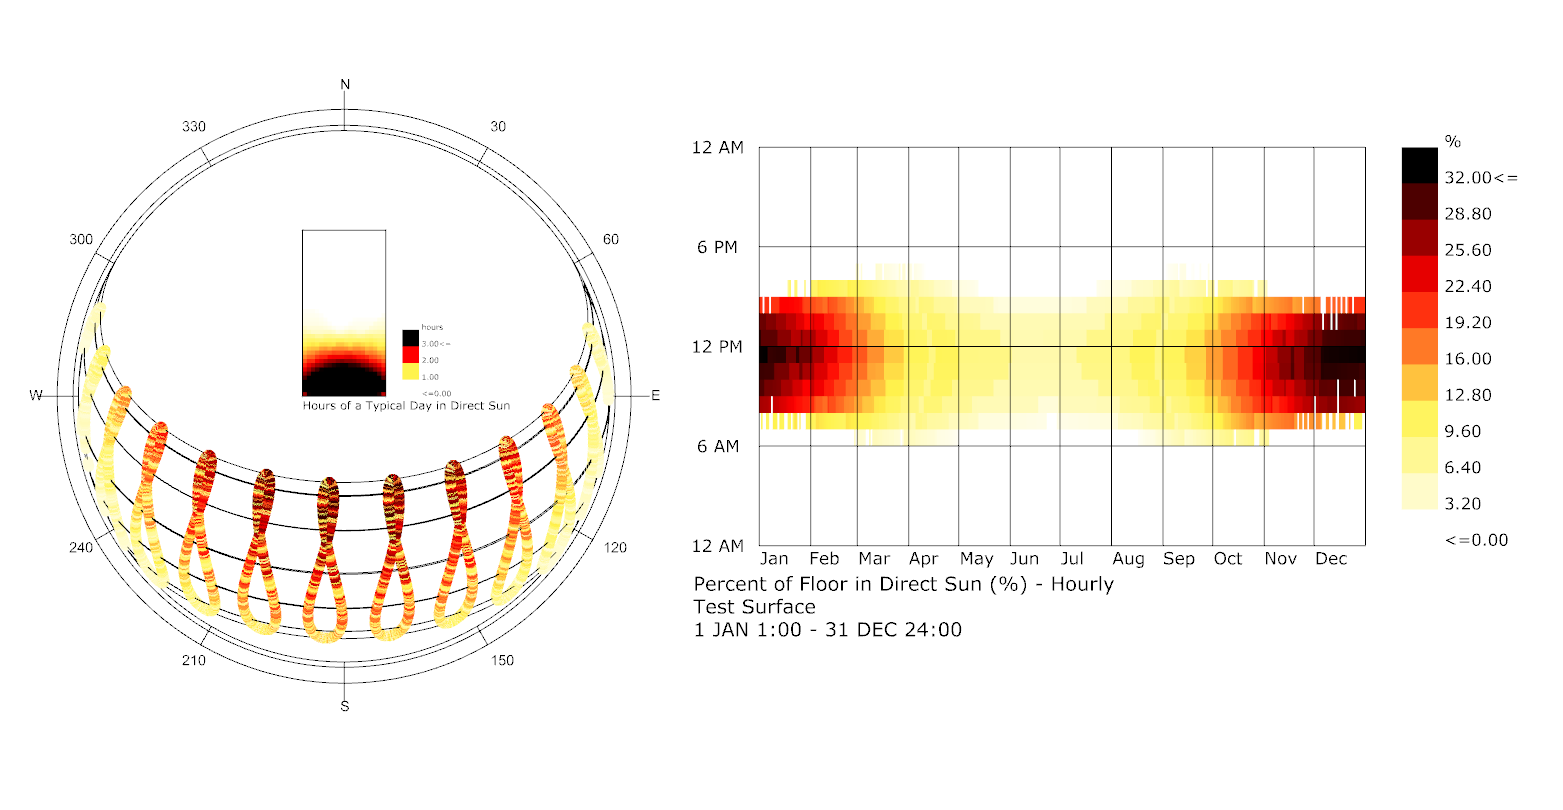
I’m fairly new to the tools but have been enjoying learning the different analysis methods… I’m curious if someone could point me in the direction of what components were used for this analysis, and how it was mapped appropriately to the 3dchart.
I got up to the point where I needed the HOY that the sunisvisible values were associated with, and was stuck trying to figure out how to get that…
This is great. Thank you for the fast response!
We’re designing a pergola to reduce the amount of direct sunlight hitting and outdoor surface, so being able to graph this is amazing. This will also help us determine when vertical blinds will need to be utilized.
So far I’ve designed various options to analyze. But I’m interested in making this a parametric thing to determine the best louver depth/thickness/spacing/rotation. I was reading you suggested Octopus for these types of studies, so that will be next adventure…
Hello again,
I got the analysis to run, and its been really helpful, however I noticed something that could potentially be a big problem for my analysis.
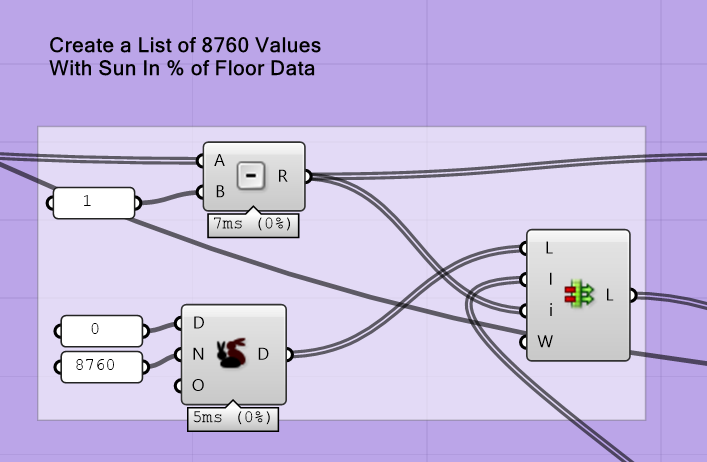
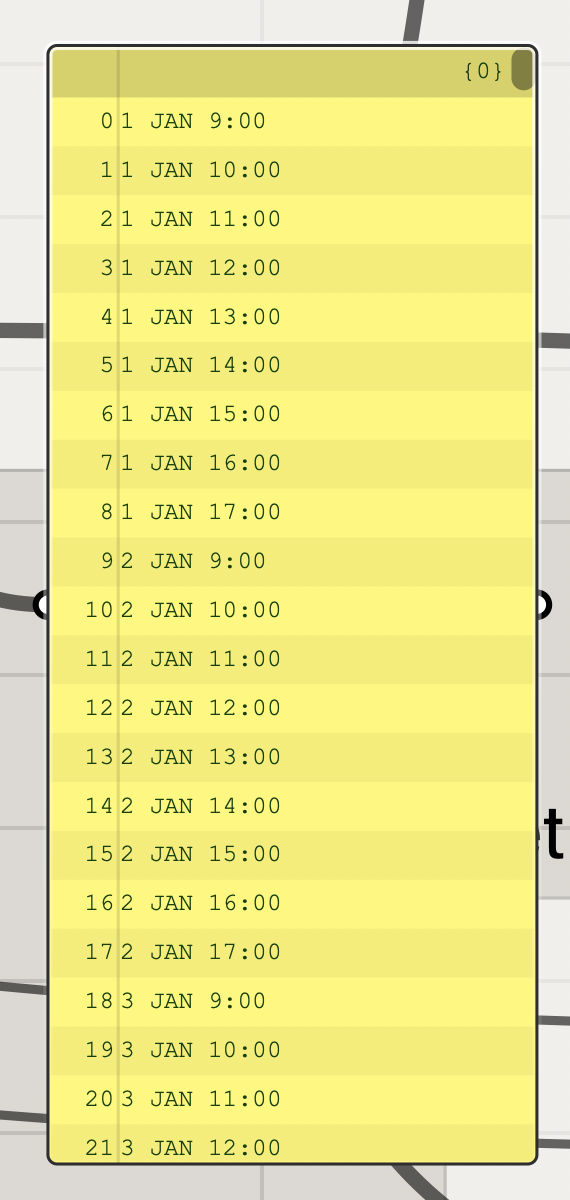
I’m curious why we subtract 1 from the “sunpositionsHOY” output of the Sunpath component?
At first it made sense since grasshopper list always start with zero… but then i noticed an issue with the 3d chart.
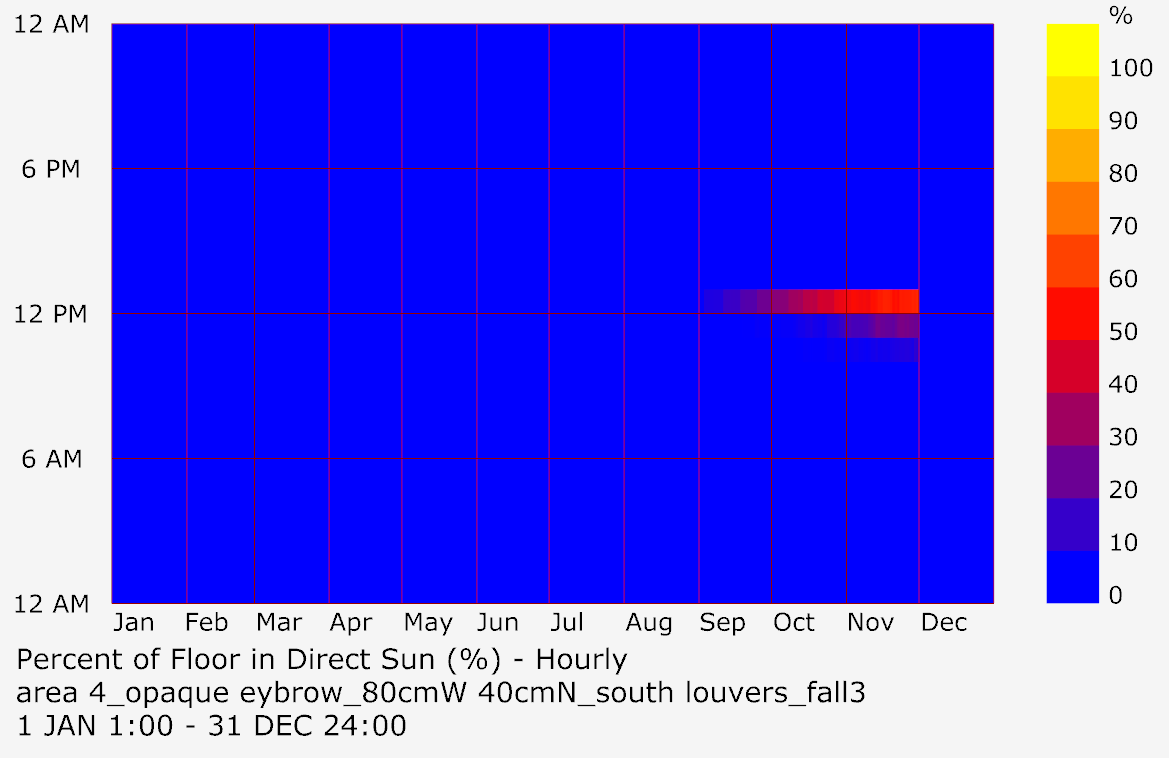
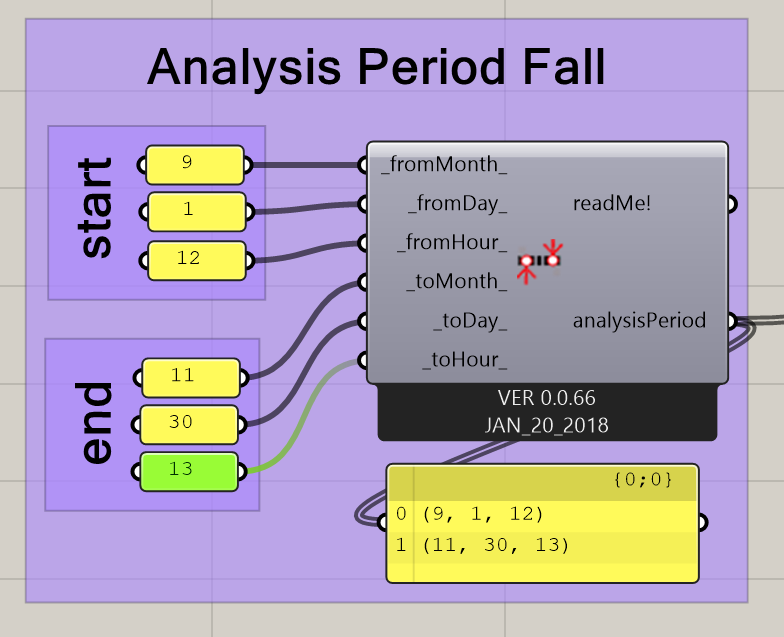
I’m putting in an analysis period on the sunpath component to examine shoulder months specifically september through november from 11am-2pm (lunch time).
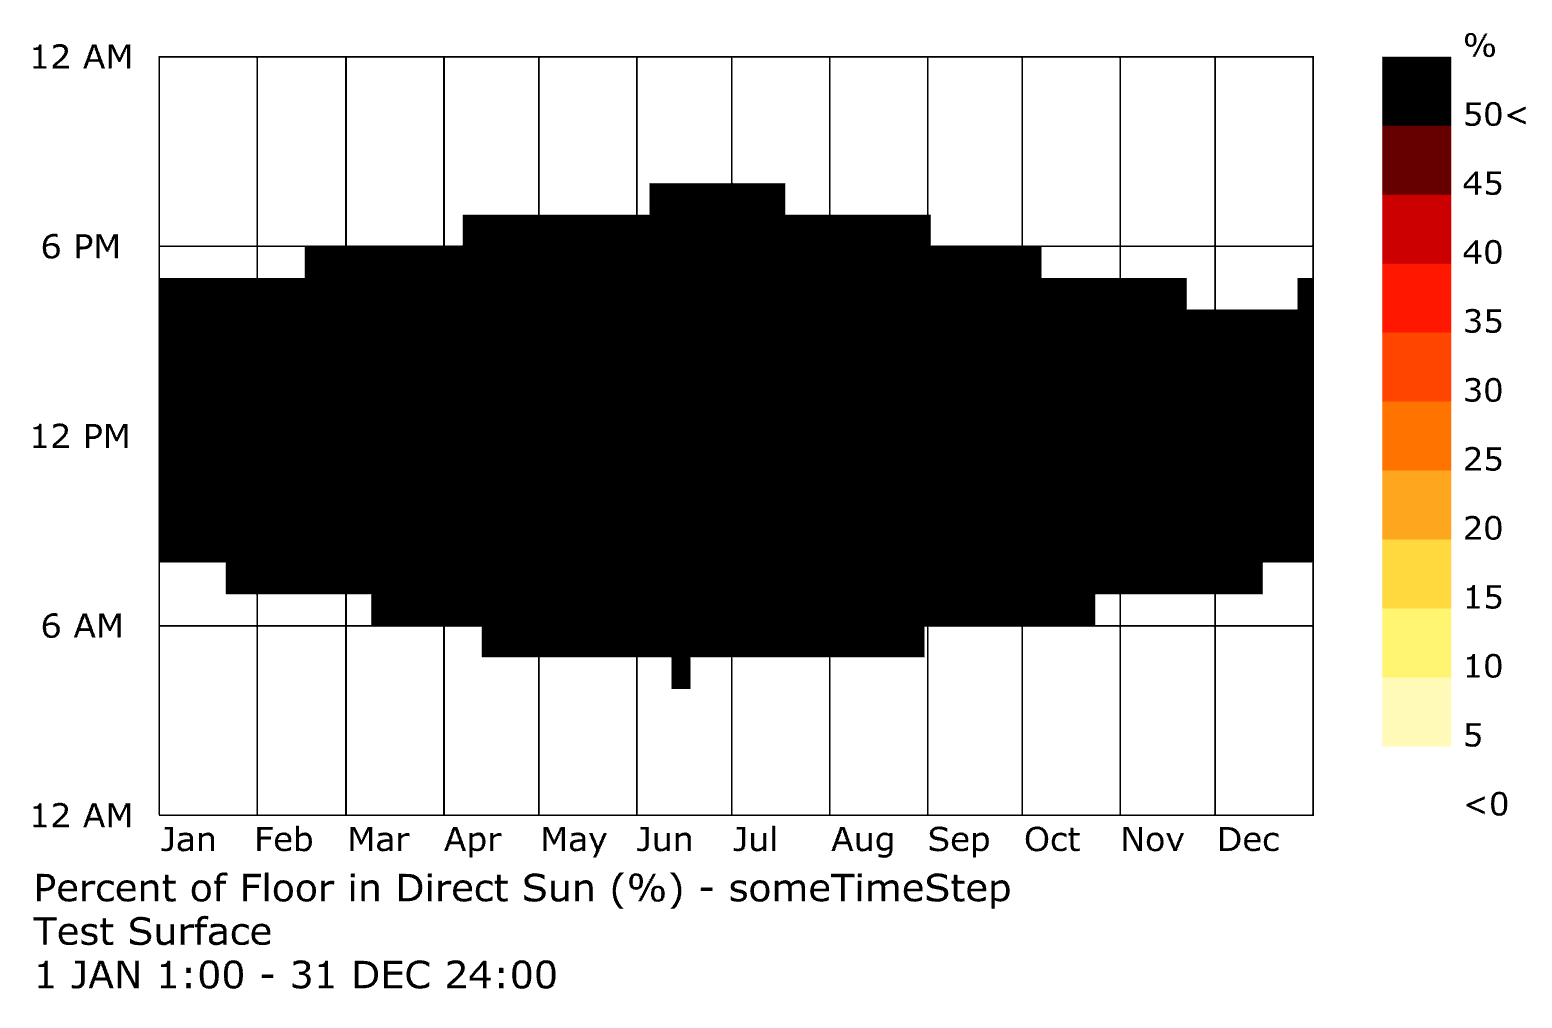
I’ve included a photo of my analysis period component and another of the 3d chart that comes out. As you can see the chart has values from 10-1 even though my analysis period should be 11-2.
I’m now worried that all of the studies I have completed are “shifted” back an hour. We reference these charts in indesign, and draw a box around the lunch time hours we’re attempting to provide shading for. With that said if change the subtract 1 to 0 then i get the results in the right time of day, but all of the data actually shifts up an hour, vs, showing a different analysis window. Hope that makes sense.
The reason why we subtract 1 from the HOYs in the results is that HOYs start counting from 1 in Ladybug Legacy but indices in a list start counting from 0. This all goes back to a really poor design decision of EPW files, in that they start from 1 AM on Jan 1 instead of counting from midnight on Jan 1. In any case, that that part of the script that you have taken a screenshot of is just converting Ladybug HOYs to indices so that we can insert the results correctly in the list (which has indices that start counting from 0).
So I don’t understand why you are saying that subtracting 0 is giving you “correct” results.
Its funny you responded last night, I was actually working out a method to verify my theory at that time. Disclaimer, I’m new to the analysis tools, and was unaware of the epw starting at 1am on Jan 1. In first pass subtracting 1 makes sense to me.
However, I setup the file to run with an open surface, and no shading, basically to see all of the hours the sun is up and hitting this surface.
When we look at the 3d chart for this analysis, I noticed the chart shows the sun rising at 8am vs 9am like the epw file shows…
I can go into how this further affects my studies but first id like to get your take on this…
Again thank you for your time, I really appreciate it!
PS. I primarily work on a Mac, and would be glad to help you guys troubleshoot the components on macOS. I’m now using these tools a lot both professionally and academically.
The solar radiation in the EPW file is structured such that the radiation value at each hour in the file is the sum of all the radiation that has occurred over the previous hour (again, I feel that this is a poor design decision of epws but we are unfortunately stuck with it). You can see this definition of solar radiation in the EnergyPlus documentation. So, when you see that the first non-zero direct normal radiation occurs at the 9:00 spot in the EPW, that means that the sun is rising between 8AM and 9 AM.
Before you get too much deeper into this, you should check out the timestep input on the Sun Path component and the yCount input on the 3D chart. You ca use these to see the exact minute at which the sun is rising/setting or falling on your test surface.
As for the mac stuff, getting full support for the Legacy plugins in Mac is a lost cause at this point. We may be able to get basic functionality like the SunPath but we’ll never be easily able to daylight or energy simulation supported on Mac. However, we are trying to develop the [+] plugins to have full support on Mac so any feedback that you can give us about the [+] plugins on the Mac side is very helpful.