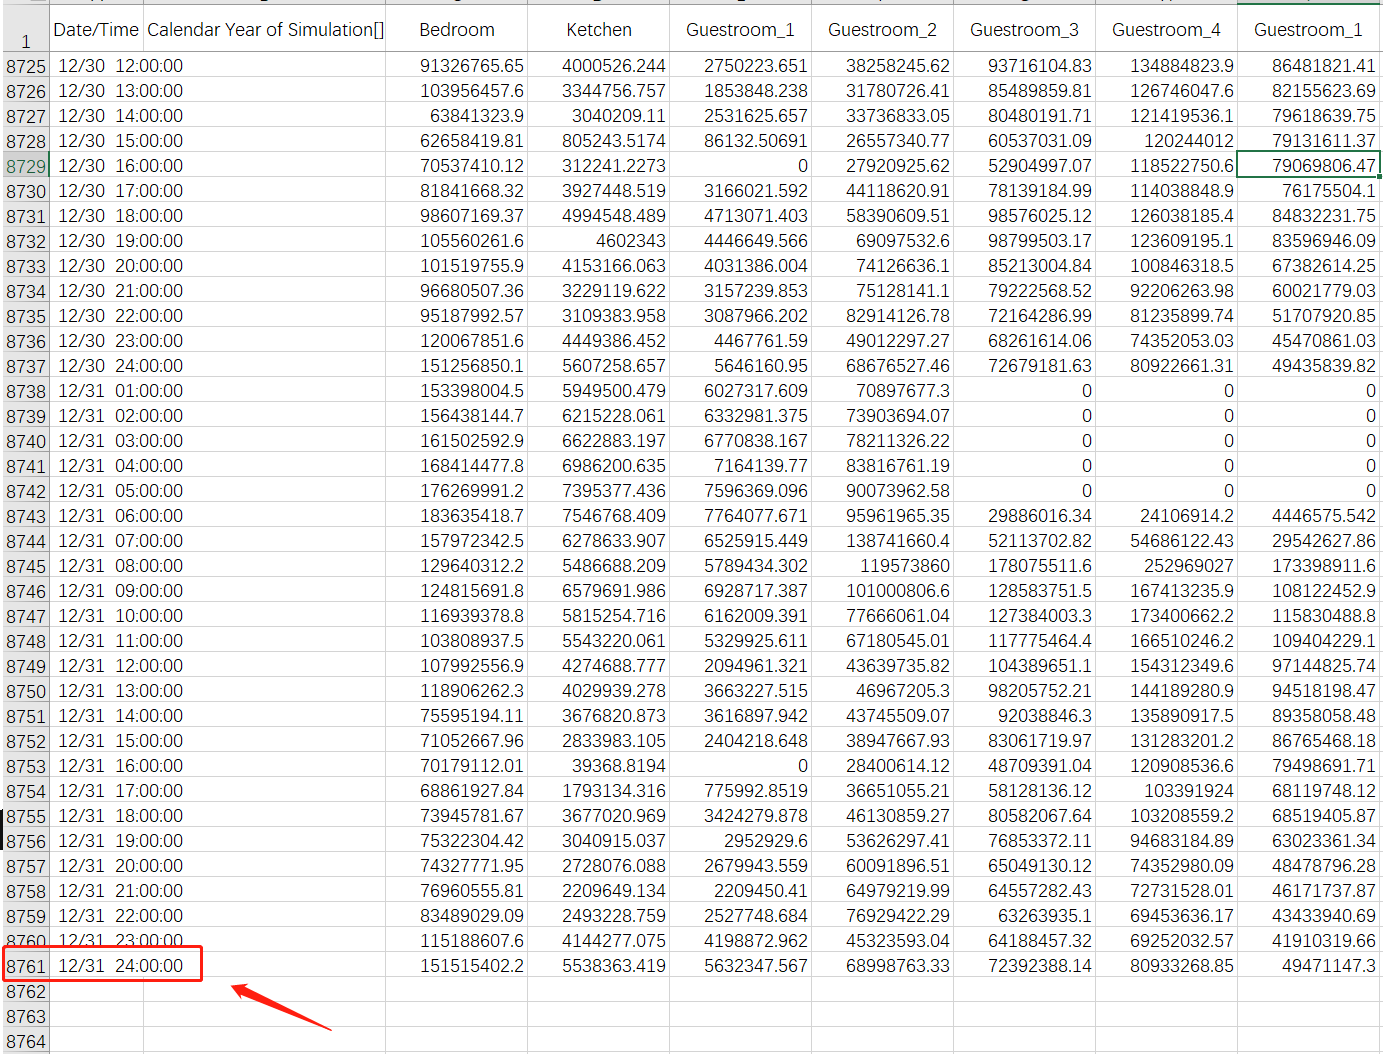
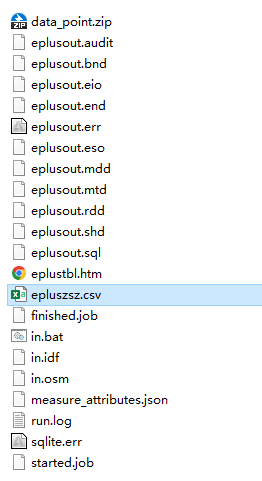
Hi guys, I’m using the new version of ladybug 1.5 and I want to export the energy consumption data for each honeybee zone for 8760 hours for the whole year in .CSV tables. Previously, I could export it when I was using the 0.66 & 0.69 versions of ladybug history, as shown below. How can I export it in LBT 1.5? I checked the file in the output address of OSM and couldn’t find it.
Hi, @Erikbeeren ,
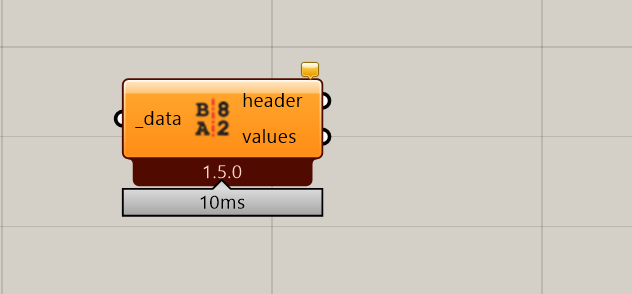
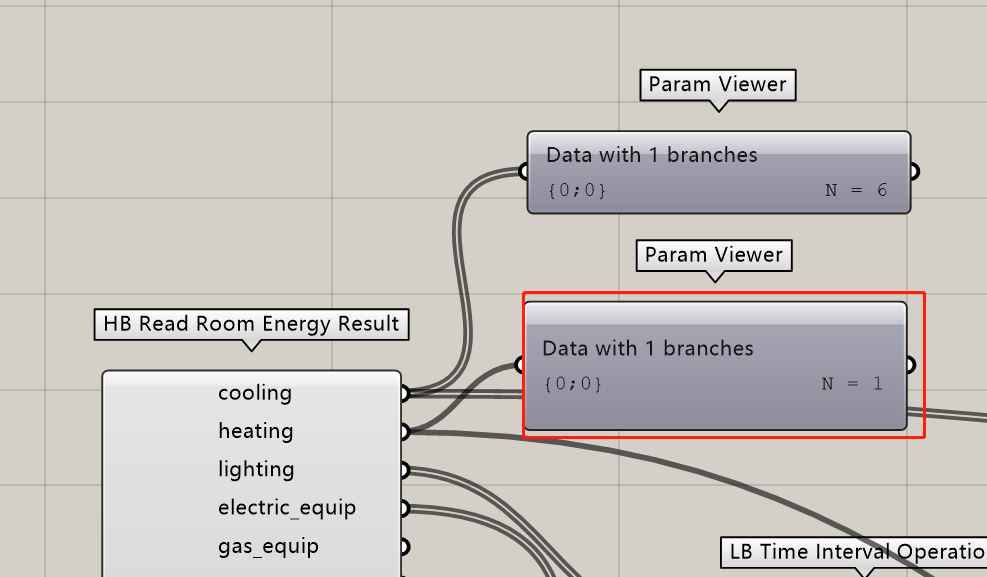
This is a good method, but I can only output a set of 8760 data here, how can I output the data by room separately for the whole year?
Thanks @Erikbeeren ,
It is true that you can output multiple rooms of COOLING, but the output of HEATING is still only one group, I wonder if it may be because the heating and air conditioning system occurs on a separate gas furnace unit, and the boiler then transfers the heat to each room through the hot water pipes, rather than one cooling unit per room like COOLING, resulting in a data type that is not generated with each room?
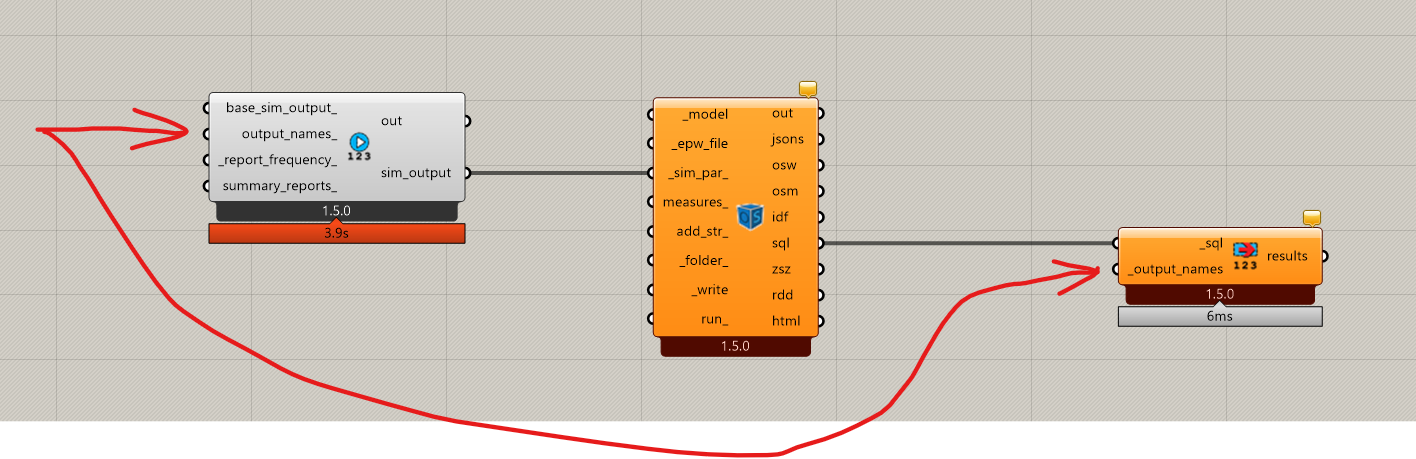
Yes what Chris describes is exactly what hapens. You can however look for the energy output of each HVAC part. When you open your generated osm file with the openstudio app you can check out which names belong to which part of the HVAC system (for example “heating coil”). You then have to run the simulation an other time and ask for these outputs with the “HB custom simulation outputs” component.
The energy consumption data output, solar gains, etc. for each month in .CSV tables with earlier versions was really helpful and handy for instant analysis. Can we please have it back?
You can still get these values. But if you want the information per room you will have to use “ideal airloads” as system. With a central air system it is not possible to get the total energy demand per room.
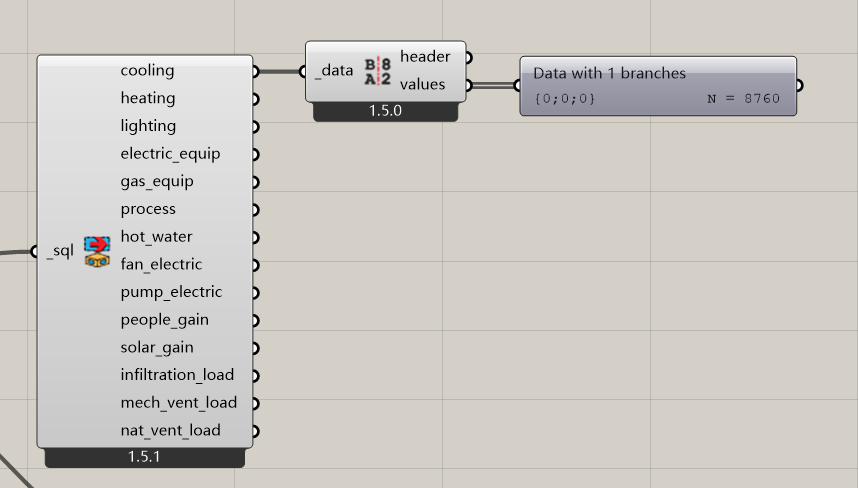
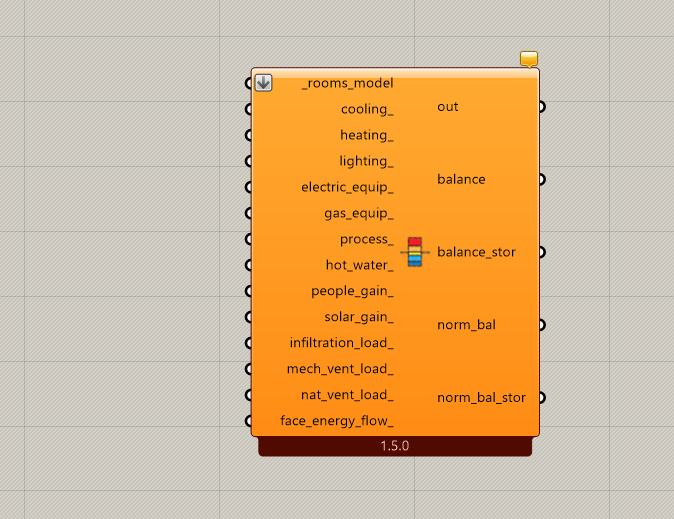
If you look at the “HB thermal Load Balance” component it gives you the information:
    cooling_: Array of data collections for 'Zone Ideal Loads Supply Air
        Cooling Energy'.
    heating_: Array of data collections for 'Zone Ideal Loads Supply Air
        Heating Energy'.
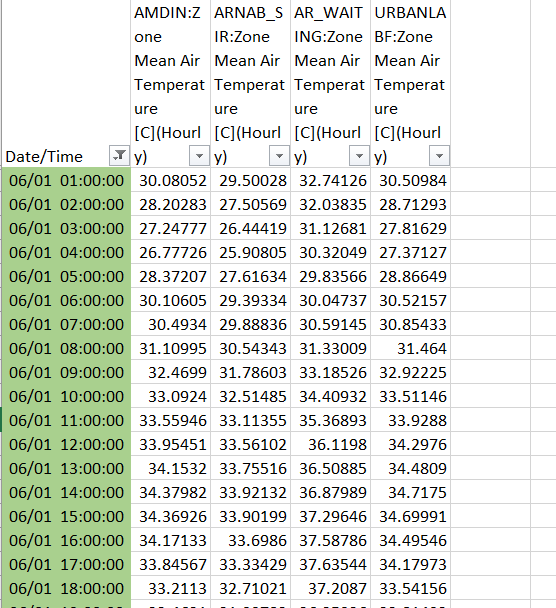
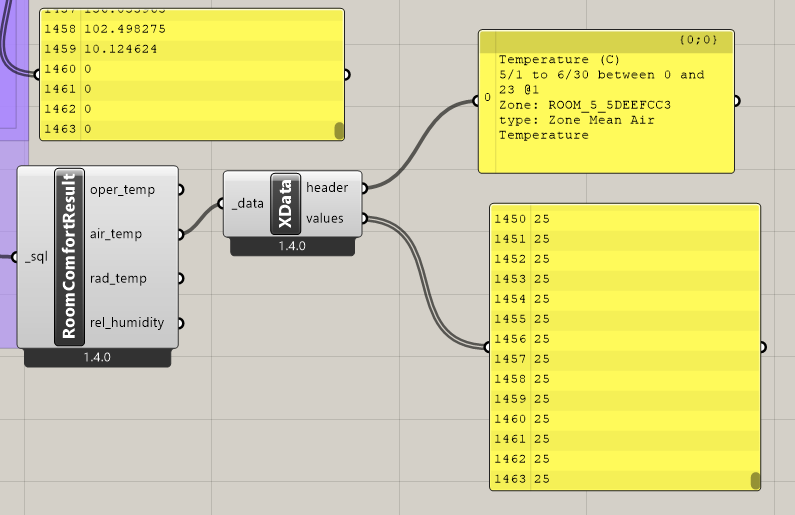
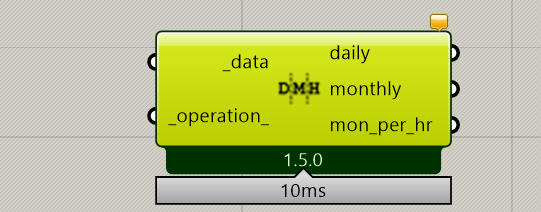
Can you please help me with how to separate hourly indoor air temperature data from sql into months-wise data with time stamp for each hour from the simulation output, as the legacy version used to provide in csv? I don’t have a background in coding, and thus csv used to be of a great help to me.
I am attaching the output with version 1.4 and legacy for your reference.