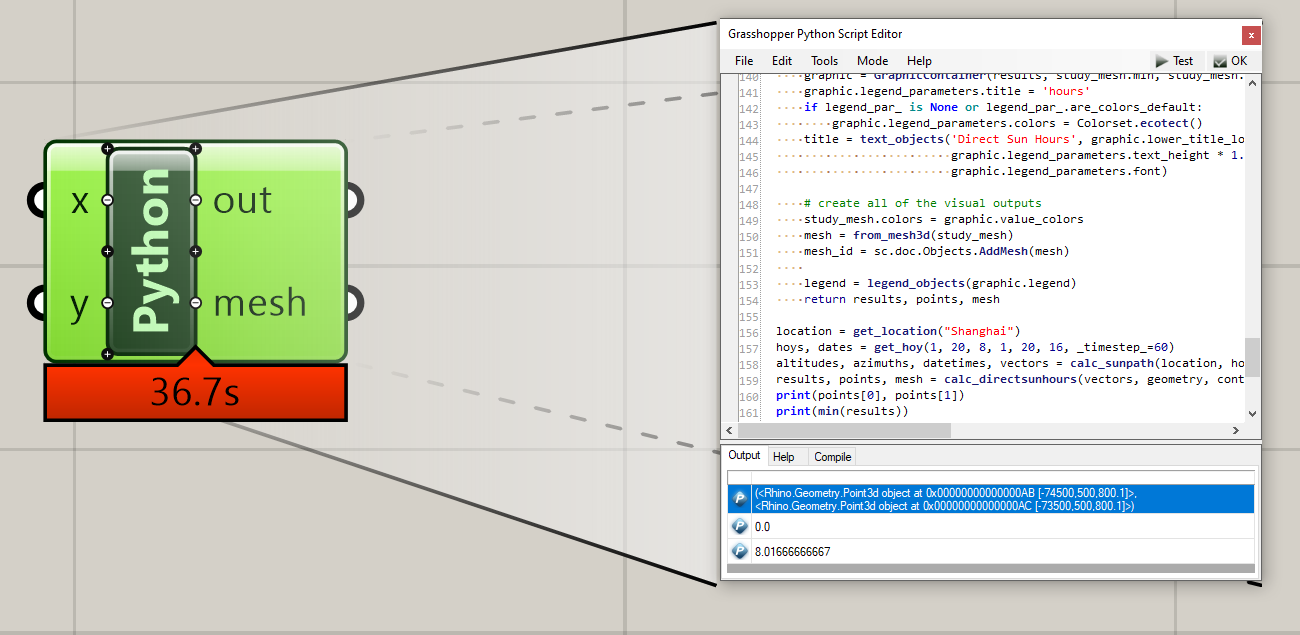
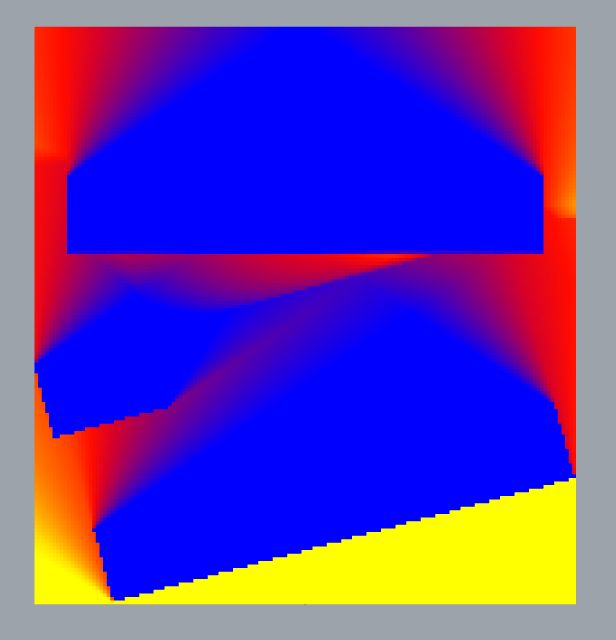
This is my unsuccessful try. I can get the results and visualize the boxes and mesh. But I can not render the heatmap.
import Rhino.Geometry as rg
import scriptcontext as sc
sc.doc.Objects.Clear()
geometry_origin = rg.Point3d(0, 0, 800)
geometry_plane = rg.Plane(geometry_origin, rg.Vector3d(1, 0, 0), rg.Vector3d(0, 1, 0))
geometry = [rg.Mesh.CreateFromPlane(geometry_plane, rg.Interval(-75000, 75000), rg.Interval(0, 160000), 150, 160)]
origins = [(-40000, 15000, 0), (-8000, 23600, 0), (24000, 32200, 0), (56000, 40800, 0), (-56500, 60500, 0),
(-49500, 108000, 0), (-16500, 108000, 0), (16500, 108000, 0), (49500, 108000, 0)]
context_origins = [rg.Point3d(x, y, z) for (x, y, z) in origins]
boxs = []
for i in range(9):
if i < 5:
plane = rg.Plane(context_origins[i], rg.Vector3d(0.965925861483, 0.258818913758, 0), rg.Vector3d(-0.258818913758, 0.965925861483, 0))
boxs.append(rg.Box(plane, rg.Interval(-16500, 16500), rg.Interval(-10500, 10500), rg.Interval(0, 45000)))
else:
plane = rg.Plane(context_origins[i], rg.Vector3d(1, 0, 0), rg.Vector3d(0, 1, 0))
boxs.append(rg.Box(plane, rg.Interval(-16500, 16500), rg.Interval(-10500, 10500), rg.Interval(0, 45000)))
context = [rg.Mesh.CreateFromBox(box, 1, 1, 1) for box in boxs]
for box in boxs:
sc.doc.Objects.AddBox(box)
_weather_URLs = {"Shanghai": "https://energyplus-weather.s3.amazonaws.com/asia_wmo_region_2/CHN/CHN_Shanghai.Shanghai.583620_CSWD/CHN_Shanghai.Shanghai.583620_CSWD.zip"}
def get_location(_city, _folder_=None):
import os
from ladybug.futil import unzip_file
from ladybug.config import folders
from ladybug_rhino.download import download_file
import ladybug.epw as epw
_weather_URL = _weather_URLs[_city]
_weather_URL = _weather_URL.strip()
_folder_name = _weather_URL.split('/')[-1][:-4]
if _folder_ is None:
_folder_ = folders.default_epw_folder
_epw_file = os.path.join(_folder_, _folder_name, _folder_name + '.epw')
if not os.path.isfile(_epw_file):
zip_file_path = os.path.join(_folder_, _folder_name, _folder_name + '.zip')
download_file(_weather_URL, zip_file_path, True)
unzip_file(zip_file_path)
ep = epw.EPW(_epw_file)
location = ep.location
return location
def get_hoy(_start_month_, _start_day_, _start_hour_,
_end_month_, _end_day_, _end_hour_, _timestep_=1):
import ladybug.analysisperiod as ap
from ladybug_rhino.grasshopper import wrap_output
anp = ap.AnalysisPeriod(
_start_month_, _start_day_, _start_hour_,
_end_month_, _end_day_, _end_hour_, _timestep_)
if anp:
period = anp
dates = wrap_output(anp.datetimes)
hoys = anp.hoys
return hoys, dates
def calc_sunpath(_location, hoys_, north_=0, dl_saving_=None, solar_time_=False):
from ladybug_rhino.fromgeometry import from_polyline3d
from ladybug.sunpath import Sunpath
from ladybug_rhino.fromgeometry import from_vector3d
sp = Sunpath.from_location(_location, north_, dl_saving_)
altitudes, azimuths, datetimes, vectors = [], [], [], []
for hoy in hoys_:
sun = sp.calculate_sun_from_hoy(hoy, solar_time_)
if sun.is_during_day:
altitudes.append(sun.altitude)
azimuths.append(sun.azimuth)
datetimes.append(sun.datetime)
vectors.append(from_vector3d(sun.sun_vector))
return altitudes, azimuths, datetimes, vectors
def calc_directsunhours(_vectors, _geometry, context_, _timestep_,
_grid_size=None,_offset_dist_=0.1, legend_par_=None):
import scriptcontext as sc
from ladybug.color import Colorset
from ladybug.graphic import GraphicContainer
from ladybug_rhino.config import conversion_to_meters
from ladybug_rhino.togeometry import to_joined_gridded_mesh3d, to_vector3d
from ladybug_rhino.fromgeometry import from_mesh3d, from_point3d, from_vector3d
from ladybug_rhino.fromobjects import legend_objects
from ladybug_rhino.text import text_objects
from ladybug_rhino.intersect import join_geometry_to_mesh, intersect_mesh_rays
from ladybug_rhino.grasshopper import all_required_inputs, hide_output, \
objectify_output
_offset_dist_ = _offset_dist_ / conversion_to_meters()
# create the gridded mesh from the geometry
study_mesh = to_joined_gridded_mesh3d(_geometry, _grid_size)
points = [from_point3d(pt.move(vec * _offset_dist_)) for pt, vec in
zip(study_mesh.face_centroids, study_mesh.face_normals)]
# mesh the geometry and context
shade_mesh = join_geometry_to_mesh(_geometry + context_)
# get the study points and reverse the sun vectors (for backward ray-tracting)
rev_vec = [from_vector3d(to_vector3d(vec).reverse()) for vec in _vectors]
normals = [from_vector3d(vec) for vec in study_mesh.face_normals]
# intersect the rays with the mesh
int_matrix, angles = intersect_mesh_rays(
shade_mesh, points, rev_vec, normals)
# compute the results
int_mtx = objectify_output('Sun Intersection Matrix', int_matrix)
if _timestep_ and _timestep_ != 1: # divide by the timestep before output
results = [sum(int_list) / _timestep_ for int_list in int_matrix]
else: # no division required
results = [sum(int_list) for int_list in int_matrix]
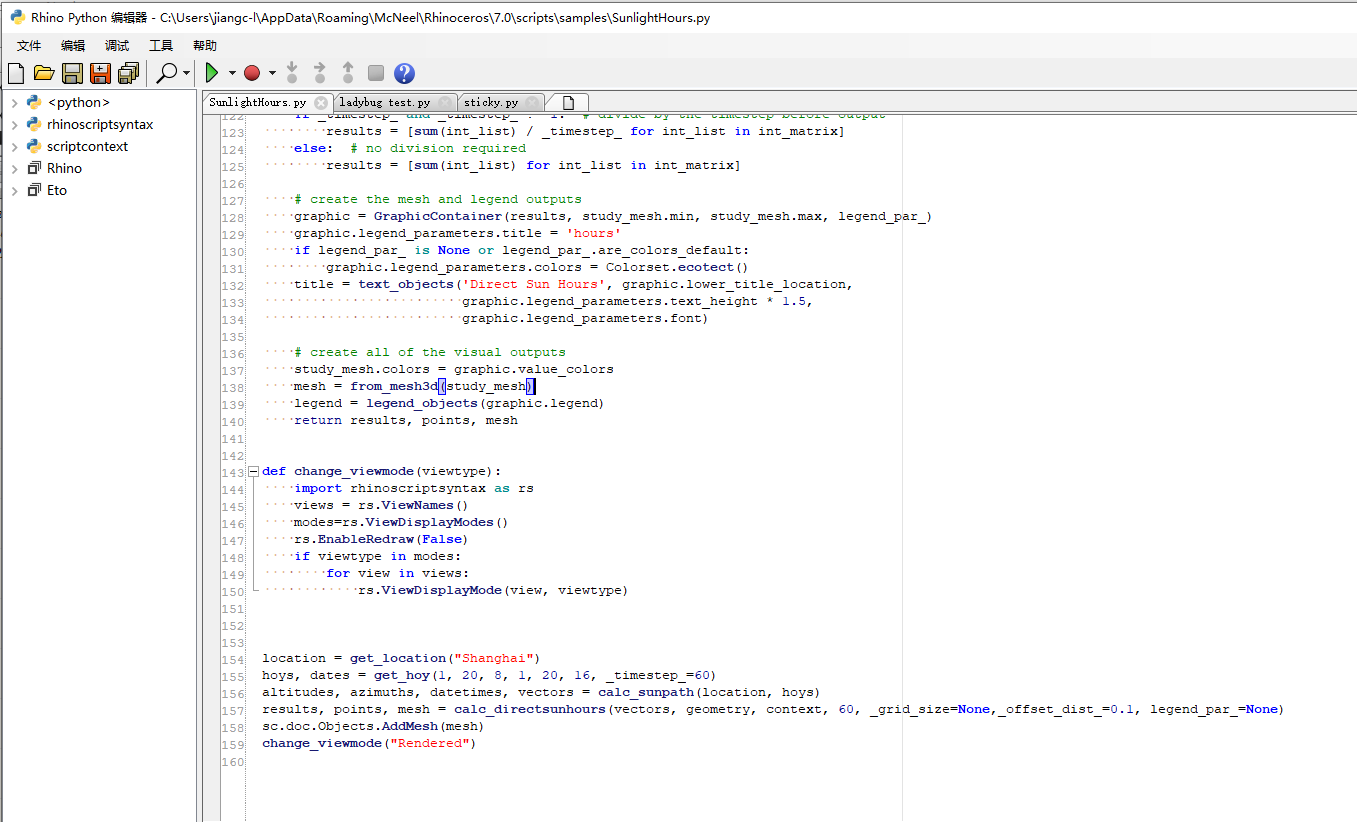
# create the mesh and legend outputs
graphic = GraphicContainer(results, study_mesh.min, study_mesh.max, legend_par_)
graphic.legend_parameters.title = 'hours'
if legend_par_ is None or legend_par_.are_colors_default:
graphic.legend_parameters.colors = Colorset.ecotect()
title = text_objects('Direct Sun Hours', graphic.lower_title_location,
graphic.legend_parameters.text_height * 1.5,
graphic.legend_parameters.font)
# create all of the visual outputs
study_mesh.colors = graphic.value_colors
mesh = from_mesh3d(study_mesh)
mesh_id = sc.doc.Objects.AddMesh(mesh)
legend = legend_objects(graphic.legend)
return results, points
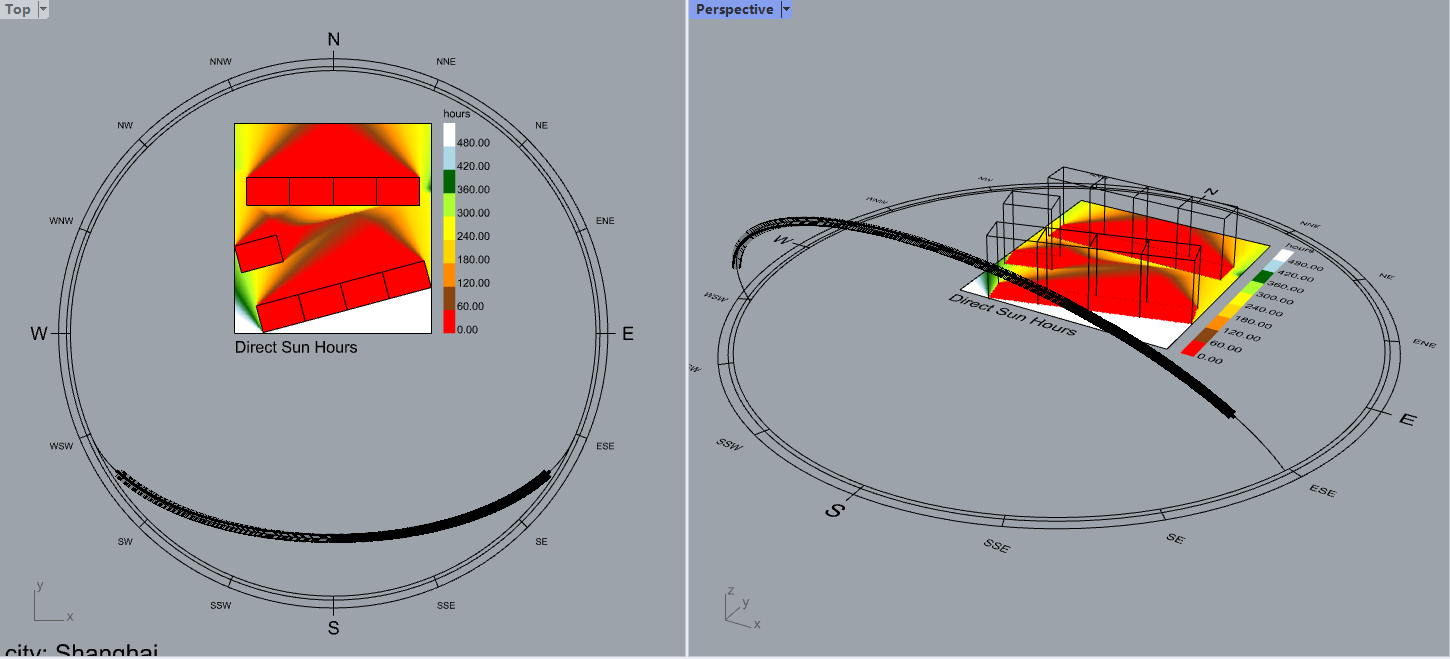
location = get_location("Shanghai")
hoys, dates = get_hoy(1, 20, 8, 1, 20, 16, _timestep_=60)
altitudes, azimuths, datetimes, vectors = calc_sunpath(location, hoys)
results, points = calc_directsunhours(vectors, geometry, context, 60, _grid_size=None,_offset_dist_=0.1, legend_par_=None)
print(points[0], points[1])
print(min(results))
print(max(results))