How to calculate outdoor Mean Radiant Temperature using Ladybug/Honeybee

Hi all,

I am trying to run an outdoor comfort simulation using LB/HB. I would like to assess the effect on thermal comfort of different pavement materials in a public square. I know that the material would affect the Mean Radiant Temperature but I do not know how to calculate the MRT in this case.
My questions are:

  • How to estimate the hourly radiant temperature of each part of the square and the surrounding buildings? Can this be done using the Energy+ and Honeybee?

  • What temperature should I consider for the sky?

Thanks in advance,

Alejandro

1 Like

Alejandro,

Honeybee can estimate the effects of the pavement but it can only be done with the comfort maps and Honeybee EnergyPlus simulation right now (unless you already know what surface temperature that your pavement produces). This shows you a simple example of the comfort maps in the outdoors:

http://hydrashare.github.io/hydra/viewer?owner=chriswmackey&for…

You want to edit the soilType on the ground zone component or make a custom HBZone with your paving material as a roof.

Here is a more advanced file with buildings:

http://hydrashare.github.io/hydra/viewer?owner=chriswmackey&for…

-Chris

2 Likes

Thank you so much Chris! It’s just what I needed.

Hi again,

I am working with the example scripts sent above to produce a microclimate map and I have some questions:

1- Is the effect of direct sun considered to calculate the surface temperature of the terrain and the surrounding buildings?

2- It seems like the surface temperature of the terrain is only one for the whole top surface, that is, it does not differentiate between areas that are shaded and areas that are exposed to sun. Is this so? I guess that is is quite different being next to a ground that has been exposed to hours of sunlight or next to one that has been shaded, right?

Thanks in advance,

Alejandro

Alejandro,

Sorry for the late response. To answer your questions:

  1. Yes, the two examples that I posted here consider the effect of sun/shade on the outdoor surface temperaturess through the EnergyPlus/ OpenStudio simulation. EnergyPlus computes the percentage of each surface that sees the sun at the different hours of the day and factors this into a dynamic energy balance calculation. Any context or zone geometry will block the sun to surfaces in the EnergyPlus calculation. However, you should note that surface temperatures will only be computed for zone geometries.

  2. If you break up the roof of the ground zone into multiple surfaces, you will get separate temperature results for each surface. This allows you to account for the thermal diversity of different areas in sun/shade. The more surfaces that you break up the roof into, the more accurate your simulation and the longer your calculation time. You will see that both examples that I have posted involve breaking up the roof of the ground zone into multiple surfaces.

Finally, I see that you asked about sky temperature in your original question and you should know that this will automatically be computed in the comfort maps using the shortwave and longwave radiation in the EPW file.

-Chris

Thank you Chris,

Yet another question. I would like to add other two factors to the microclimate simulation: local wind speed and evapotranspiration from plants. Is it possible?

1- Local wind speed: I heard that you are working on the integration of Butterfly with HB/LB to include the effect of local wind speed to evaluate microclimate. Have you already produced any examples on this? If so, it would be very useful.

The way I am working with this right now is exporting the wind simulation results from another software (Autodesk CFD) and importing them into Grasshopper. I run simulation for 8 wind directions (every 45 degrees) and extrapolating the local wind speed for each point hourly considering the hourly weather data (wind speed and wind direction).

2- Evapotranspiration effect from trees and other plants. Is it possible at all to evaluate this with HB? I have not found any reference to evapotranspiration in the forum.

Thanks in advance!

Alejandro

Hi Alejandro and Chris,

Any updates on this? On my side I am facing a similar problem.

I have been analyzing Outdoor comfort on a rather big area surrounded by retail and commercial buildings (I have around 12000 test points). I am working with Butterfly to calculate the wind speed and EnergyPlus for the Outdoor Temperatures of the surfaces.

I am working with the workflow developed by Chris here:

http://hydrashare.github.io/hydra/viewer?owner=chriswmackey&for…

and adding the CFD results.

After computing a single CFD simulation, I am now trying to input the list of values with the wind speed results(12000 wind speed values for the same 12000 test points) to the _windspeed input of the UTCI Comfort Recipe component. However, the component expects an annual list of data per point (12.000 branches, each of them with 8760 values). As you can imagine, such a vast list of data crashes Rhino and Grasshopper.

Is there any workaround this, to make the component accept only 1 value per point? My idea is to use the result from the CFD simulation for whatever the analysis period is required later in the Microclimate analysis component.

Thanks in advance,

Rafael

1 Like

Hello community, I resurrect this question because I see some strange results.

I wanted to calculate the Mean Radiant temperature for outdoor using Honeybee, I mean, the effect of grass and concrete pavement on the air, I take the example of this post:

And I see some strange results:

  1. If I use Export to Openstudio Battery for calculations with thermal_absorptance on grass 0.6 : The air temperature is reversed, the air over grass is warmer but the surfaces are ok:

  1. If I use Run Energyplus Battery, I cant use thermal_absorptance less than 0.81. It says:
    The simulation has not run correctly because of this severe error:
    ** Severe ** [Material:RoofVegetation][GREENROOF][thermal_absorptance] - “0.600000” - Expected number greater than 0.800000

  2. So, If I increase the thermal absorptance to 0.81 this is the result: Surfaces ok but there are no differences in the air temperature

  3. And, If I use again export to openstudio, with thermal absorptance to 0.81, the results on surfaces and air is different than Eplus.

I attach the grasshopperfile with the point 4 setting

OutdoorComfort_HB.gh (713.5 KB)

Thanks again!

Well, I was investigating a little more about my question number 1, and I show my conclusions, I appreciate if someone can check these ideas, if they find something wrong.

I found the most important values to change the surface temperature and air temperature from radiation of the surface material (Oh surprise) I didnt use to change this parameters before for normal energy indoor simulations.

Attach link to description of each surface properties: https://designbuilder.co.uk/helpv4.2/Content/SurfaceProperties.htm

As energyplus has surfaces properties by default, I attach some materials properties:

Solar absortance: https://www.engineeringtoolbox.com/solar-radiation-absorbed-materials-d_1568.html

Thermal absortance (aka emissitivy coefficients): https://www.engineeringtoolbox.com/emissivity-coefficients-d_447.html

If I create these materials:

Grasss
Thermal absorptance (0.81 - Because energyplus battery doesnt allow setting low 0.6 for grass material)
Solar absorptance 0.6

Concrete
Thermal absorptance 0.85
Solar absorptance 0.60

Asphalt
Thermal absorptance 0.96
Solar absorptance 0.90

Polished metal
Thermal absorptance 0.10
Solar absorptance 0.30

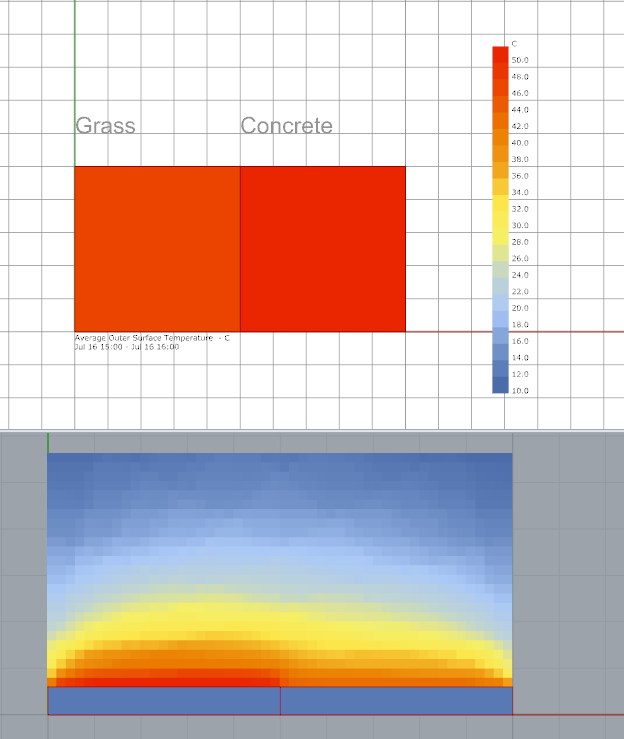
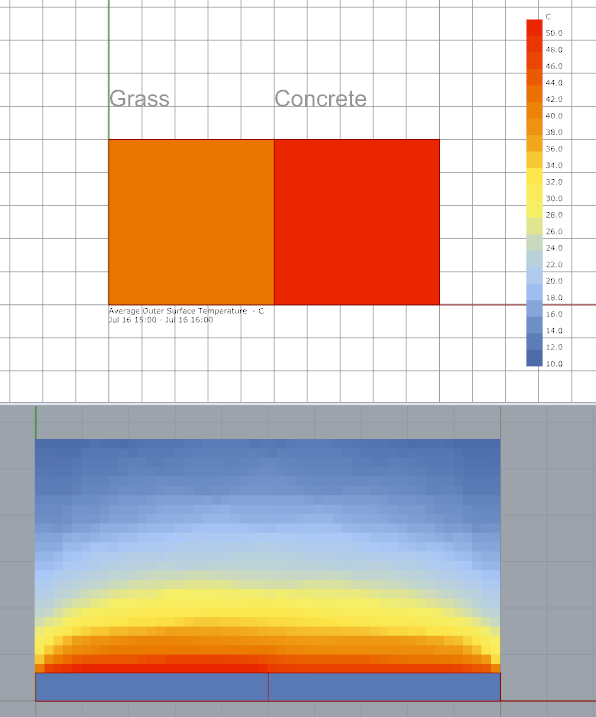
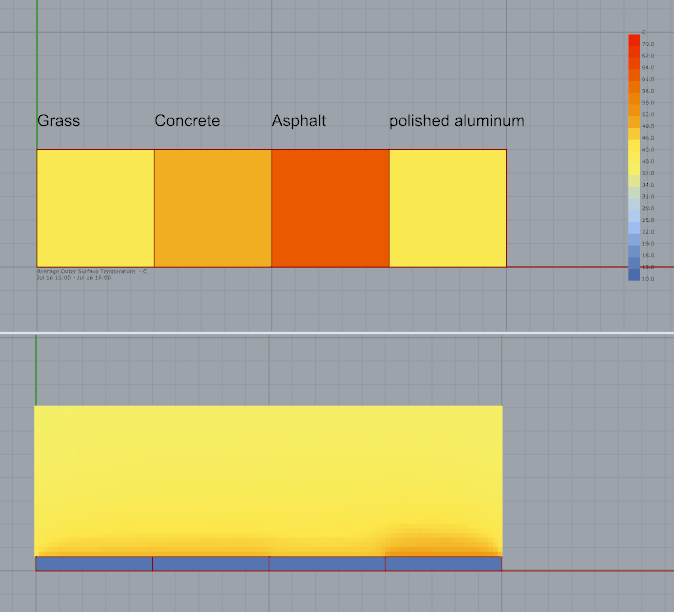
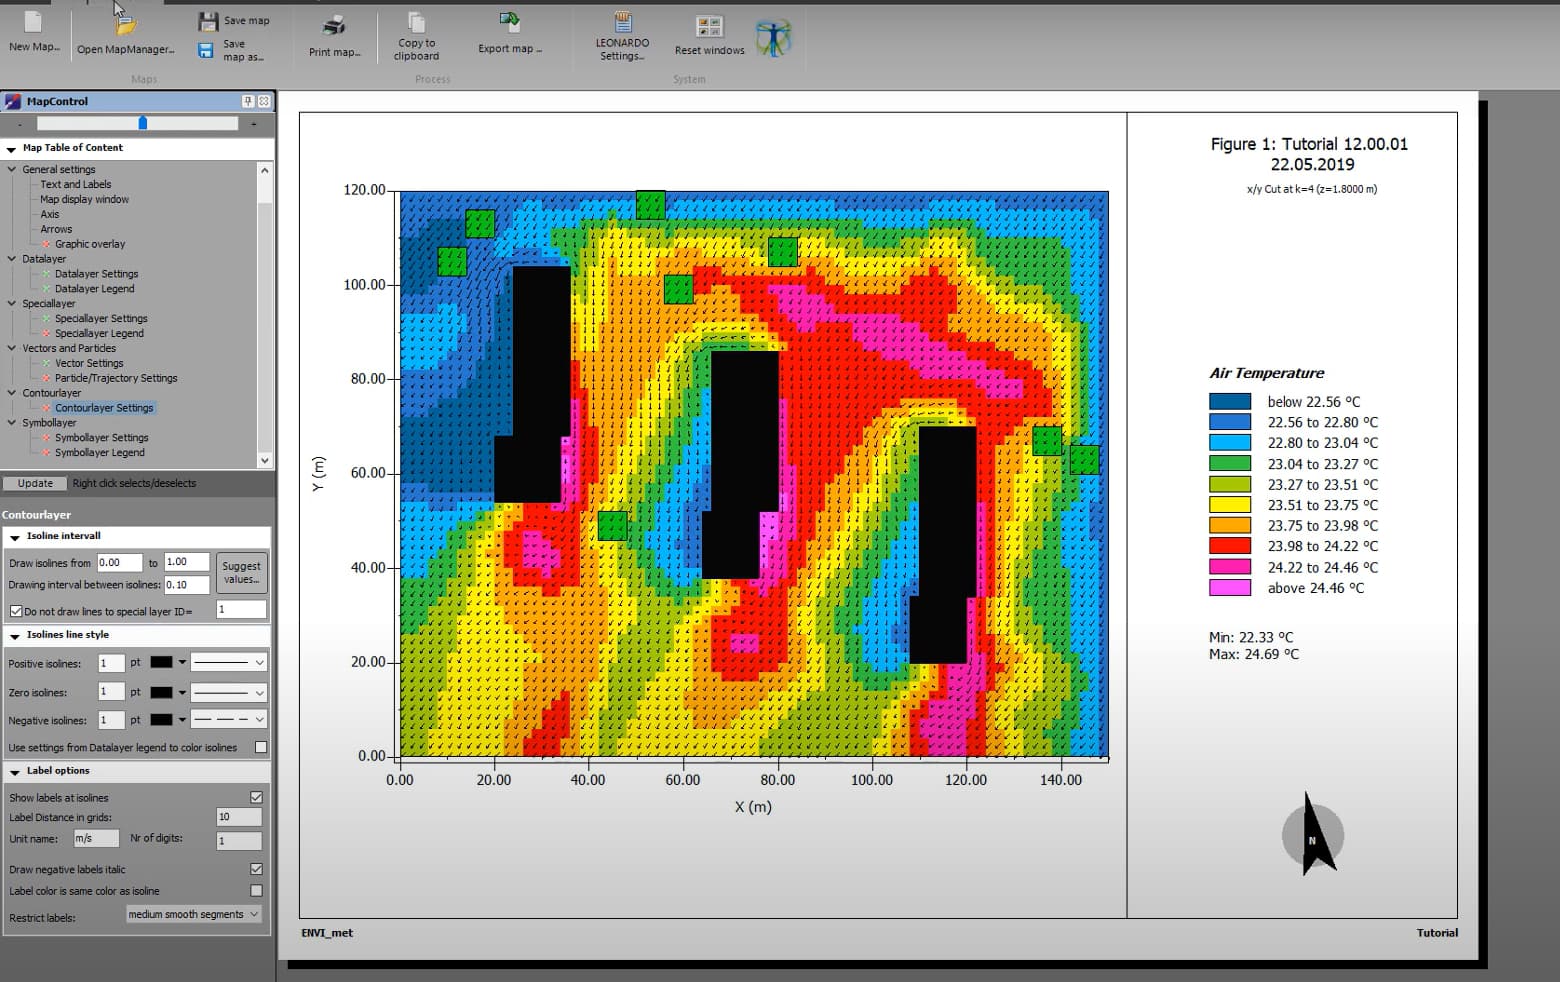
I have these results (The air temperature surfaces analysis is PET (physchological equivalent temperature)

I see the surface of asphalt is the warmest material (Because has high thermal and solar absortance), and the polsihed metal is less warm (Has low values). but I was surprised because the radiant temperature is higher in the metal.

So can I say the low solar and thermal absortance materials increase the heat island effect? I though high absortance materials like asphalt has more impact.

Also, I think these result are not very reliable, because the surfaces are really little, If I set the air temperature I didnt see big changes.

The rest of the doubs, I didnt found any answer.

Thanks.

2 Likes

Hi @gonchotorena - do you know how the PET is being calculated? The conclusion of “low solar and thermal absorptance materials increase the heat island effect” is not quite correct based on my understanding of urban heat island effect.

If the PET calculation does use radiative heat transfer to calculate PET for each point in space, it’s possible that your result is due to the polished aluminum surface simply acting as a mirror to reflect solar radiation. This would also explain why the PET value seems to be higher with concrete than asphalt.

not sure if the grass behave in such a way. Also the asphalt should re-radiate earlier…

daytimetest


2 Likes

4 posts were split to a new topic: Calculating Outdoor MRT with LBT Ladybug

Hello, did you solve the problem? because I’m doing the same analysis and I can’t produce a so different result for concrete and grass material. Moreover I can’t find the “albedo” input that, if I understood well, could change definetly the results.
Thanks

I have the same problem,
Would some experts please explain what exactly is going on through this methodology?
Questions are clear:
by using Ladybug tools,

  • How to simulate Outdoor Surface temperature? based on different surface materials;
  • How do these warmed surfaces affect the air temperature during the day?
    Any help is very very appreciated, especially by providing a sample.

Thanks,

I an answer these quickly.

We use EnergyPlus for this. you can set all of the properties to whatever you want, including reflectance, heat capacity, etc. It even has a vegetation material that can model lawns and shrubs. EnergyPlus will compute the incident solar and the heat exchange in and out of the surface.

On the outdoors? You’re only going to find a noticeable effect if you have a lot of surface area that’s different from “airport EPW” conditions. Essentially, you would need something at a meteorological scale (eg. urban heat island effect) if you want to see an outdoor air temperature difference. Or you need something that’s going to physically trap the air around a given surface. But then it’s probably not really “outdoors” at that point.

In any event, you can model the urban heat island effect using the Dragonfly plugin, which will morph the EPW to account for urban heat island effect.

Thanks a lot @chris Chris for your response,

Which tools should I use to result in surface temperature? As far as I know, both Ladybug and Honeybee plugins contain modules to calculate the incident solar. In my case, I want to estimate the air temperature around a large building (located in campus) surrounded by parking lots, and green areas (grass, dense trees, parks …). So it is very common that different microclimate zone happens on different sides of the building in question.
My preliminary plan was to estimate the incident radiation, convert it to surface temperature, then use it as the boundary condition to estimate the air temperature surrounding the building.
Was my workflow right? if yes, is there any tool aggregating these steps on Ladyboog Toolset?

Thanks, I will try this tool. for now, I am not sure it is able to show microclimate variety around the building. My goal is to see if the thermal zones (e.g. located on the north and south sides ) of the building are exposed to different air temperatures.

Dear @chris,
I have tried to use Dragonfly and UWG tools, and noticed there is a strange sensitivity to the direction of the building, especially in running the " DF Run Urban Weather Generator" tool.
The GH file is attached to show where exactly the problem is.
Just switch between input geometries, labeled as:
1- Parallel Building,
2- Rotated Building,

I am not sure if there is a bug in the tool or I missed something.
Bug_in_Dragonfly.gh (34.8 KB)

Make sure that you supply a terrain surface for the Dragonfly UWG model and you are rotating the terrain with the building. Otherwise, you’ll be dramatically changing the density of the buildings on the overall site and the corresponding intensity of the UHI.

1 Like

Hi chris
My research focuses on small-scale urban outdoor public space. I hope to investigate the influence of different spatial shielding design and vegetation designon on outdoor environmental performance. Usually ENVI-Met is used to predict environmental performance like this.

I am a beginner on Ladybug Tools. I wonder if I can make similar predictions with this? My original idea was to generate the EPW of the urban environment through Dragonfly UWG, and then simulate the outdoor environment with HB+BF. Could such an approach achieve similar results?