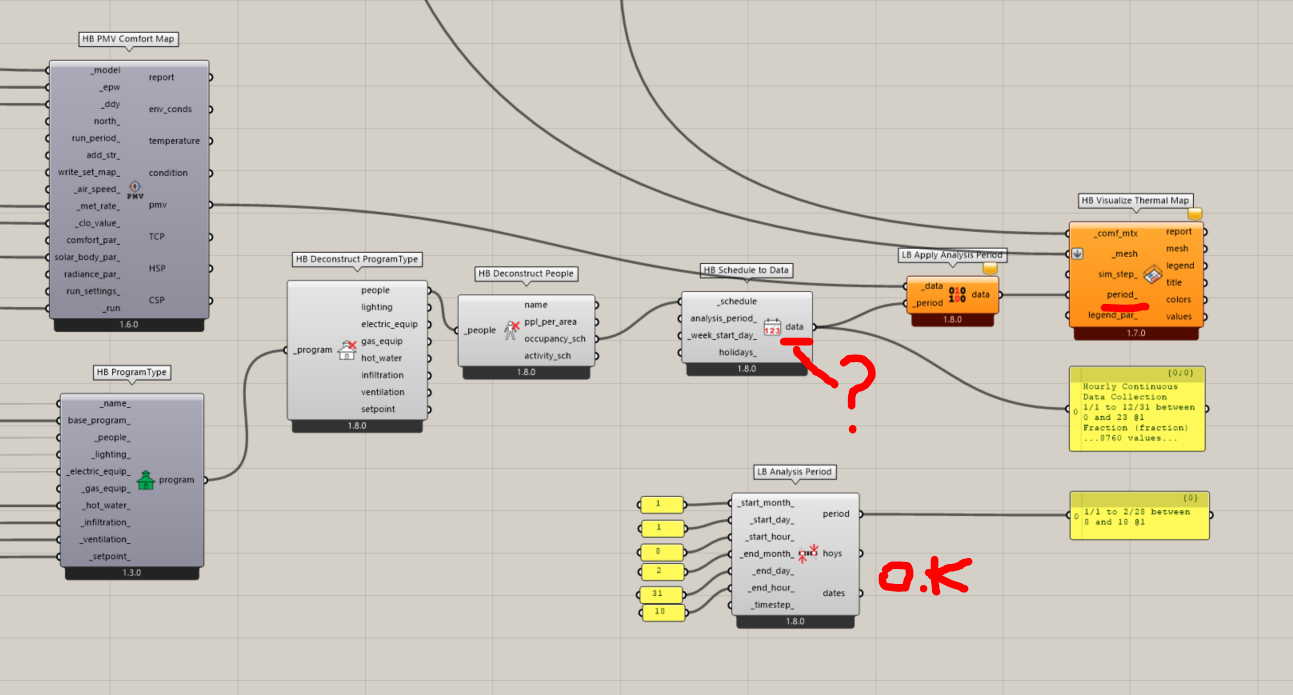
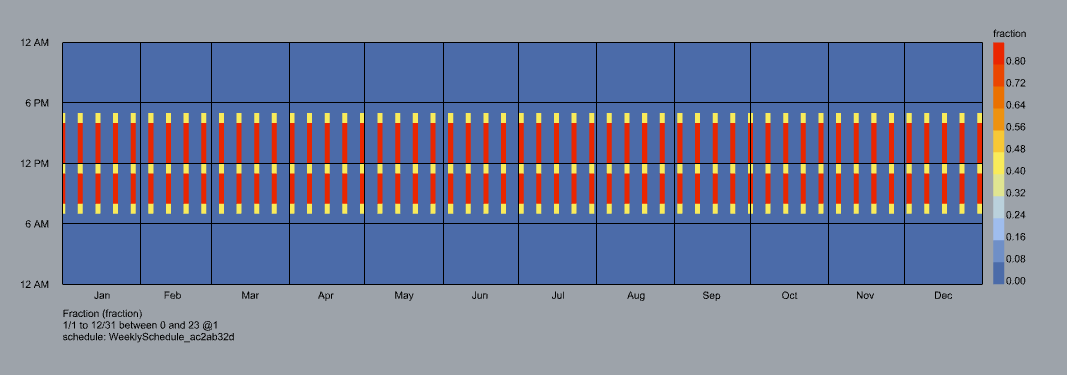
I’m currently working on setting up the PMV analysis to only run during occupied hours. I’ve tried using the LB apply analysis period, but it’s not doing what I need. HB Visualize Thermal map seems to only work if I apply a period, but then I can’t exclude weekends and holidays. Can anyone help me figure out how to convert the people occupancy schedule into a period instead of just data?
From what I can see in your screenshot, the period for the schedule is annual. Why do you need to connect the data directly to the period? You can use the LB Analysis Period component to create an annual period.
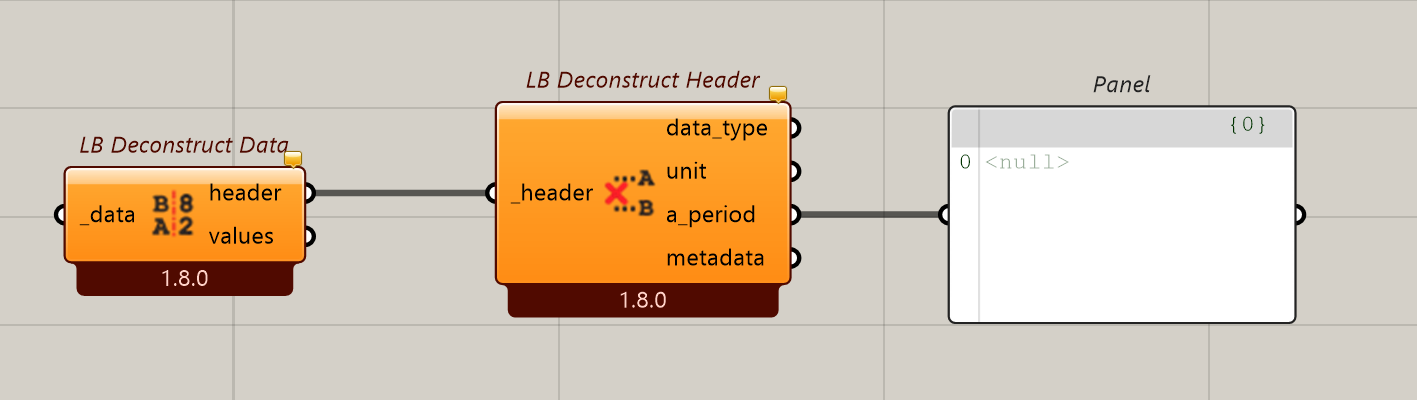
You should also be able to extract the period like this from the data.
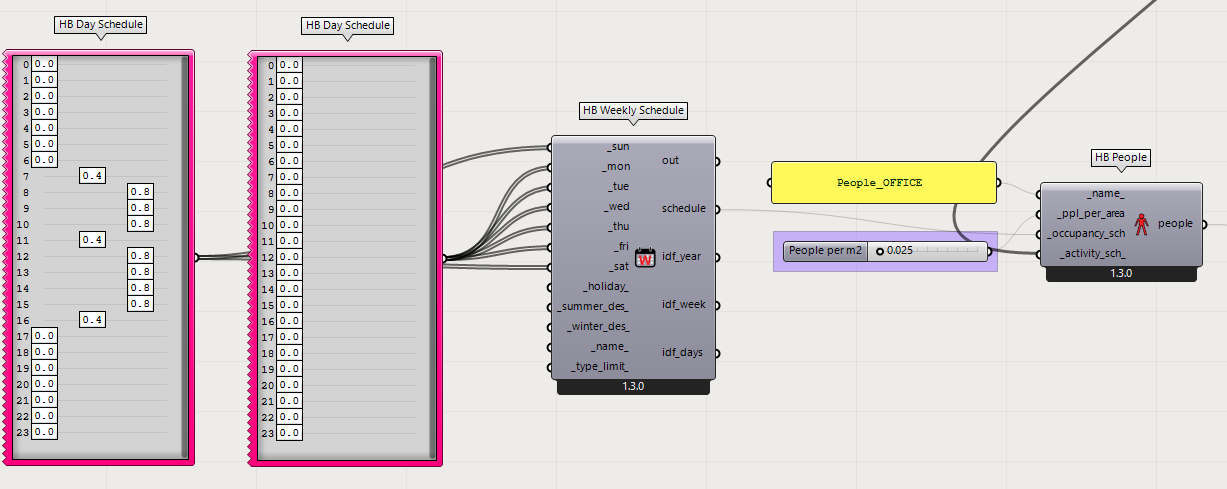
I appreciate your insights. My intention was to conduct the analysis solely during occupied hours (excluding the weekends), as per my occupancy schedule. As you mentioned, it’s an annual schedule that accounts for working hours only.
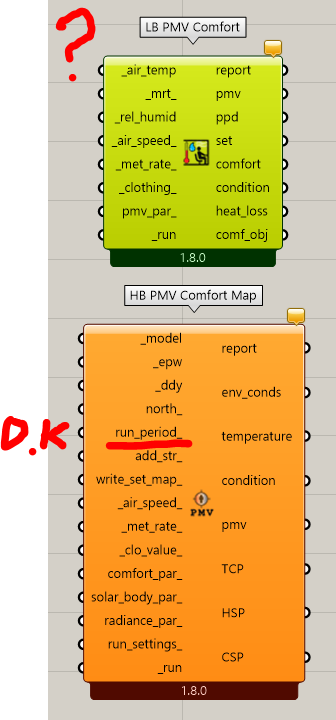
I’ve connected this schedule into the HB PMV Comfort Map to analyze solely the occupied hours.(run_period input)
I’m curious if there’s a method to analyze specific periods when using the LB PMV Comfort component?
I see! I don’t know the answer to that question. @chris is the right person to help you with that. If I remember correctly an analysis period is not as flexible as a schedule but the recipe might have some internal logic that allows for setting up the schedule as you need.
As I understood from @mostapha , the analysis period component is not as flexible as a schedule. Could you assist me in setting up the HB PMV comfort map and the LB PMV comfort component to analyze solely the occupied hours?
Sorry for the late response. We just got past a lot of deadlines and a big conference.
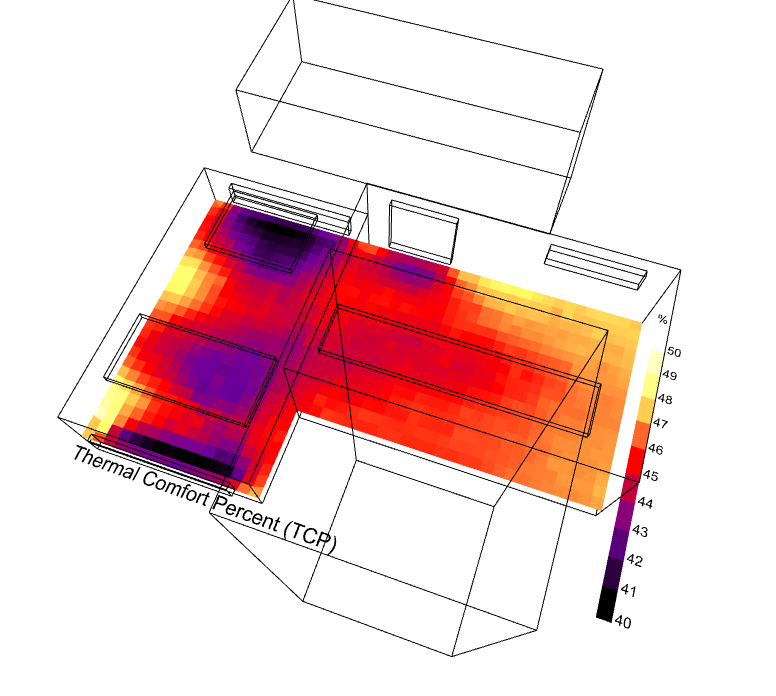
Just to make sure that you are aware - the TCP, HSP, and CSP values that you get out of all of the thermal mapping components are computed for only the occupied hours. The HB-Energy occupancy schedules of the Rooms are used to determine this and any hour that has an occupancy less than 0.1 is considered unoccupied. When a given sensor is not inside any Room, all hours are assumed to be occupied. If you read the output descriptions of TCP, HSP and CSP, they describe this in detail.
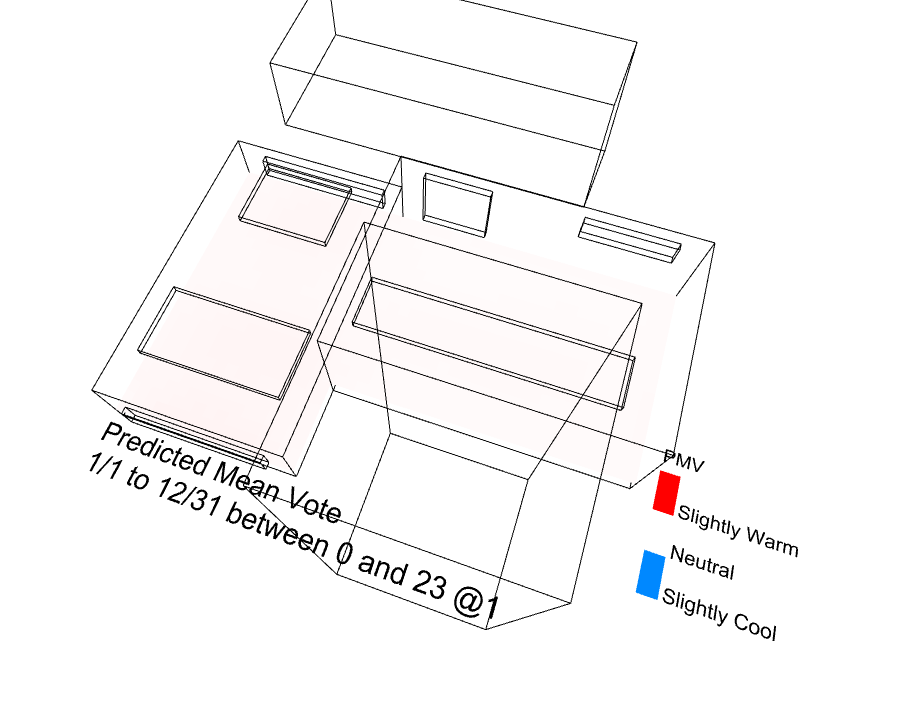
With this said, I realize that you just want to look at an average PMV and not a time-aggregated metric like TCP:
Personally, I think you risk averaging out the high and low PMV values when you do this but who am I to judge how you want to analyze your data.
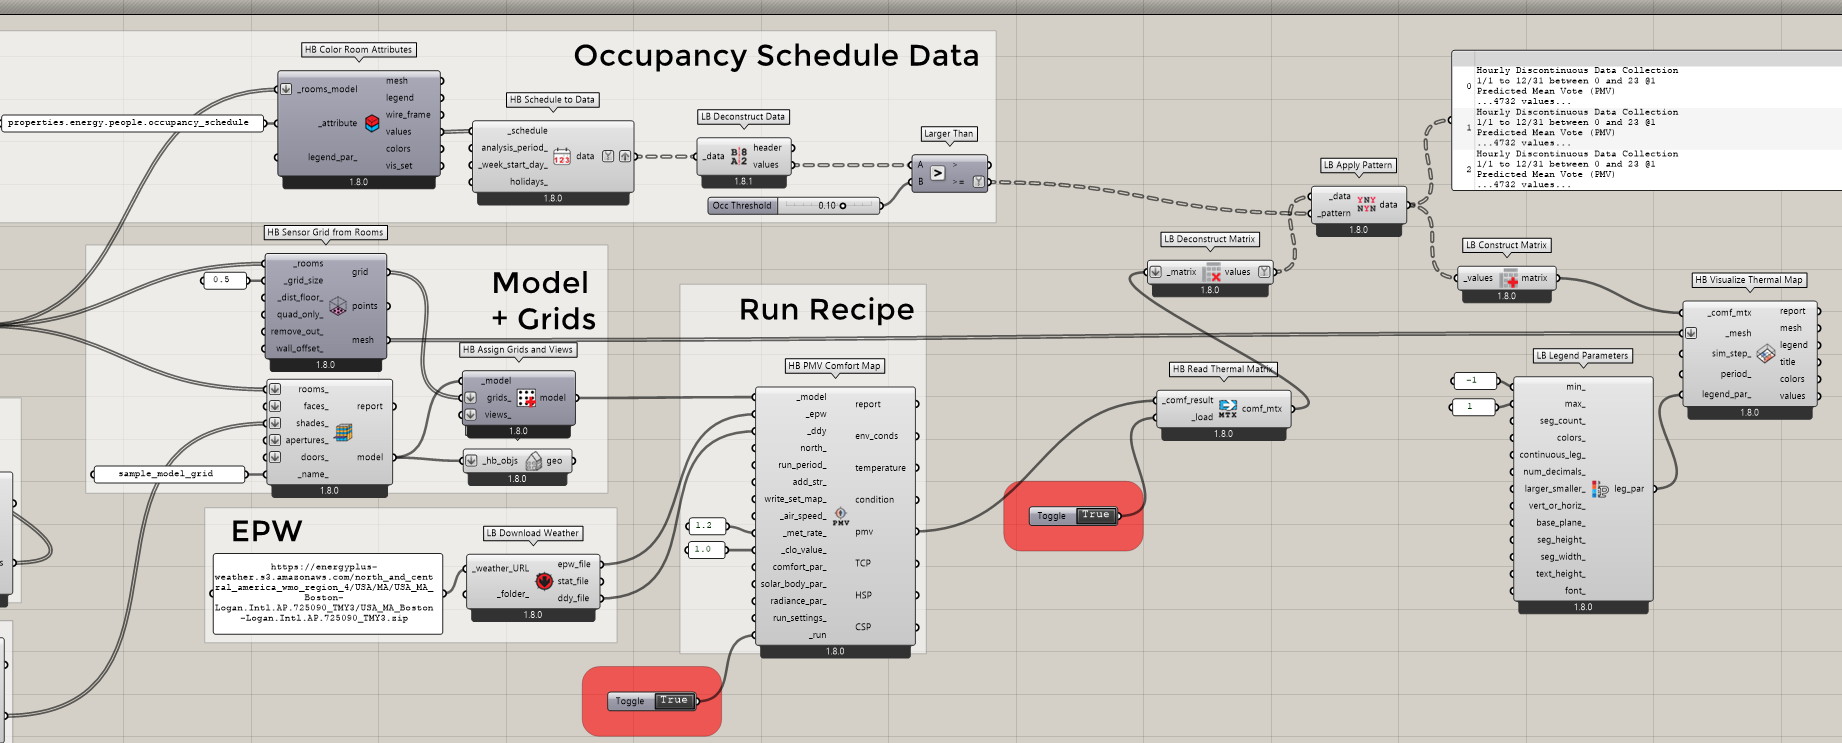
In order to get the results filtered by the occupancy schedule, you would normally have to deconstruct all of the data collections in the matrix of PMV data. Then you would have to use native Grasshopper Math components to select out just the occupied hours and rebuild the data collections and matrix before plugging it into the HB Visualize Thermal Map component.
To make this process a little easier, I just added a new component to Ladybug that lets you filter data collections by a pattern of True/False values, which makes this whole thing a little faster with fewer components:
With the new component, this is what the whole workflow looks like:
No need to apologize.
Thank you very much for the new component, I really appreciate it. As someone relatively new to this topic, I value your insights on the risks of averaging PMV values.
I plan to experiment with different PMV simulations—hourly, daily, seasonal, and annual—to assess thermal comfort over various periods. This approach aims to capture the variability of environmental conditions and occupant behavior.
I agree with you that the TCP is graphically more informative. However, I’m currently focused on building a script that aligns with LEED and Danish standards.