Dear @mostapha,
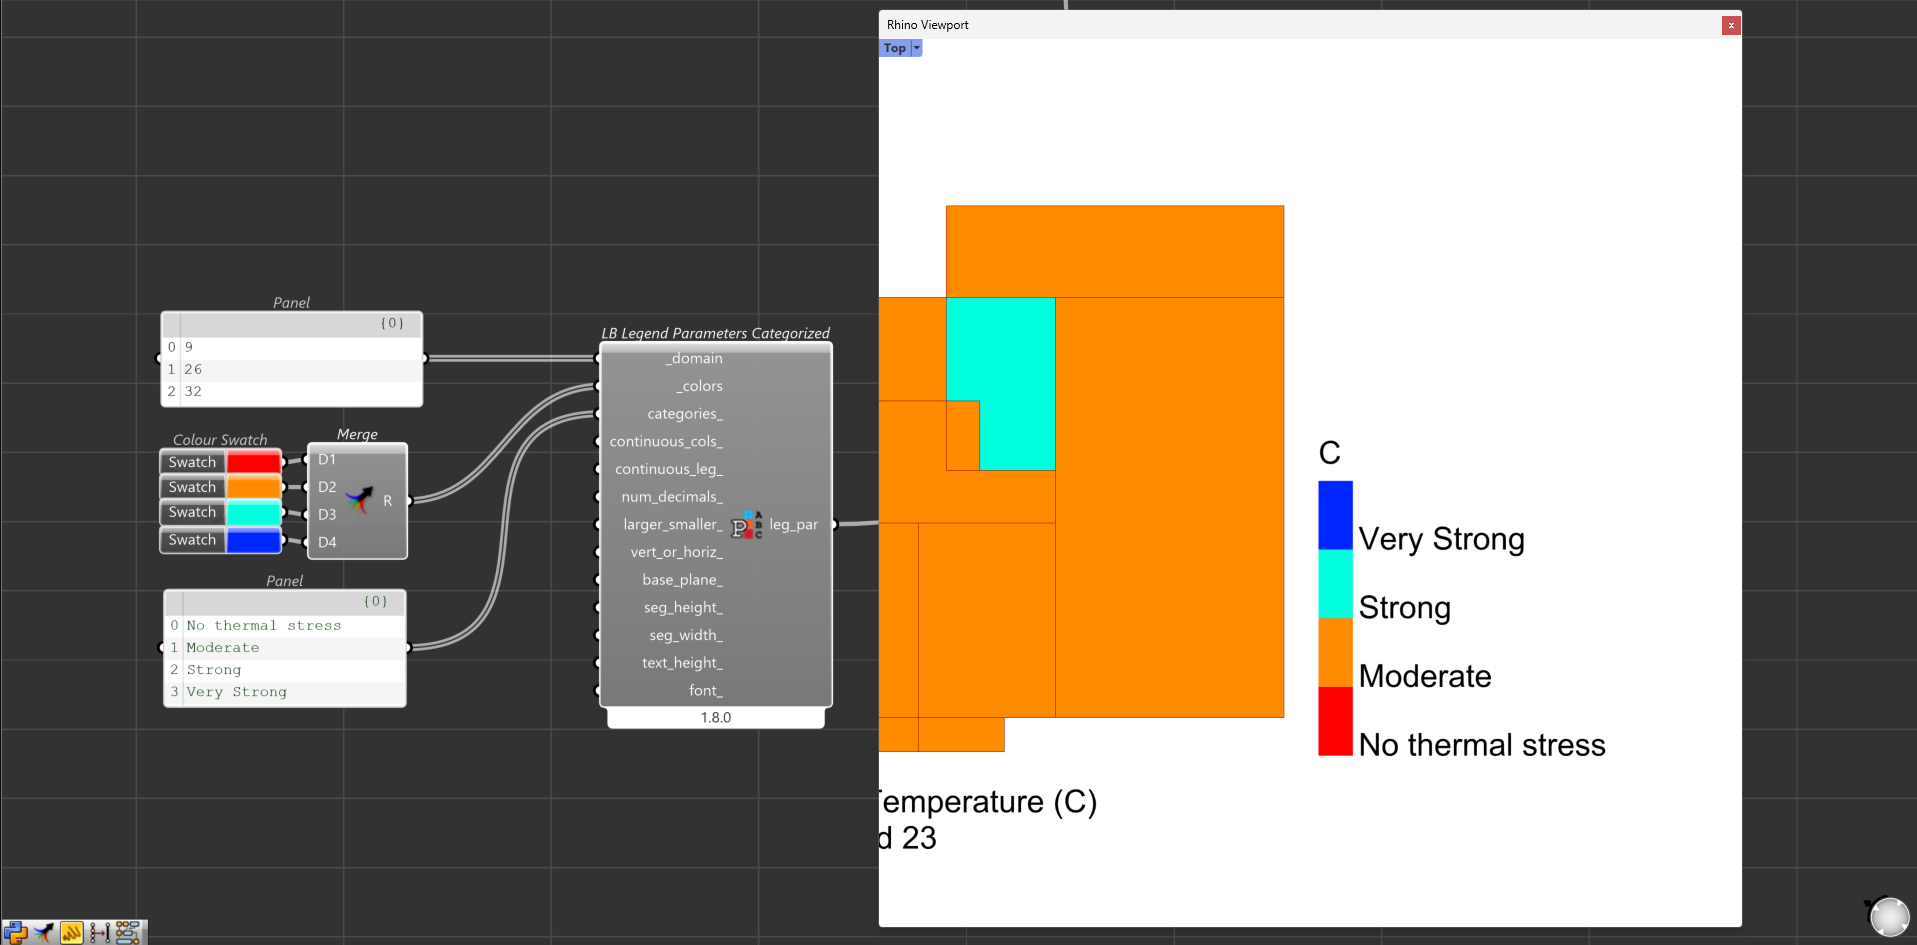
I hope you are doing well. I am working on the UTCI and would like to visualize a comfort map with the ranges of values below and their corresponding category name:
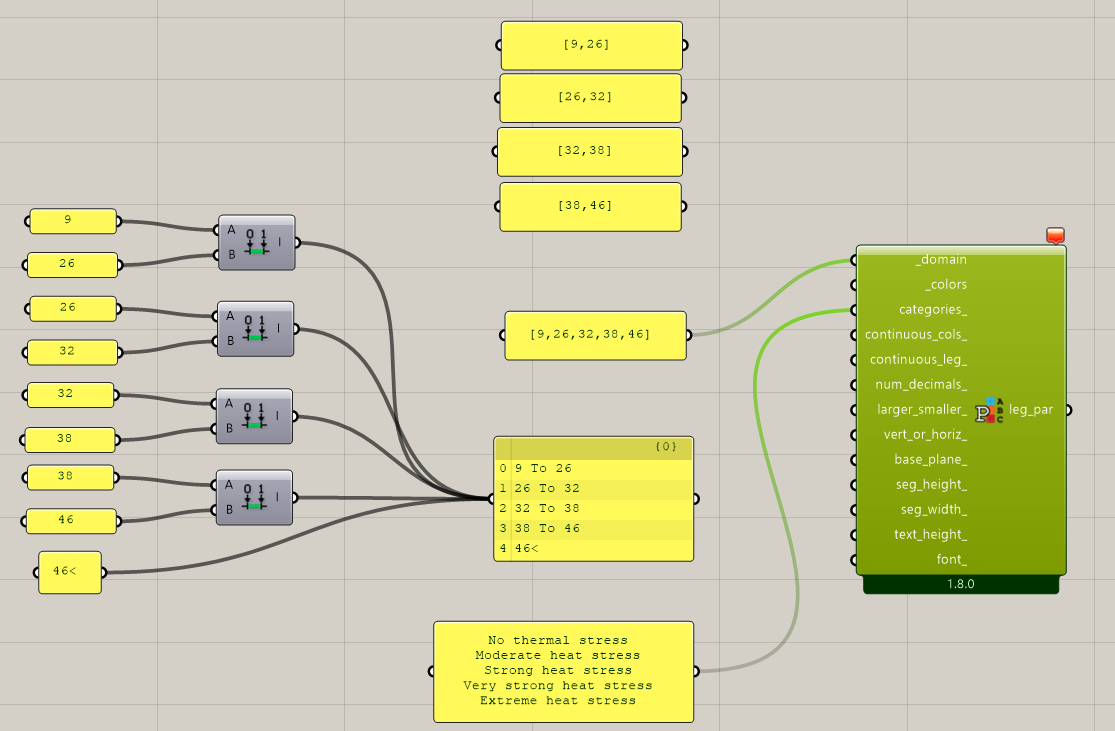
*No thermal stress (UTCI range: +9 to +26°C),
*moderate heat stress (UTCI range: +26 to +32°C),
*strong heat stress (UTCI range: +32 to +38°C),
*very strong heat stress (UTCI range: +38 to +46°C),
*extreme heat stress (UTCI range: > +46°C)
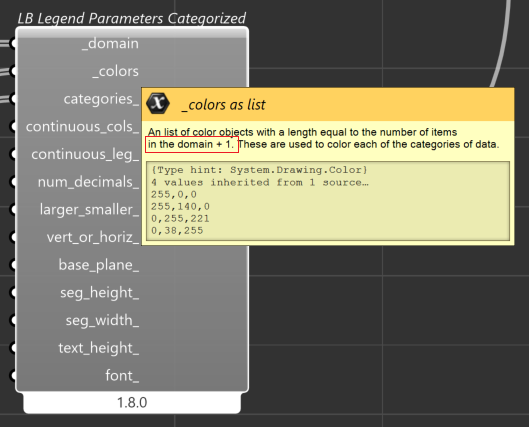
I was not able to do so by using Leg_Par or Leg_par_categorized components. Would you please let me know if it is possible to do it in Ladybug plugin or not, if yes, how?
Thank you very much for your time.
Best regards,
Sepideh