Hello,
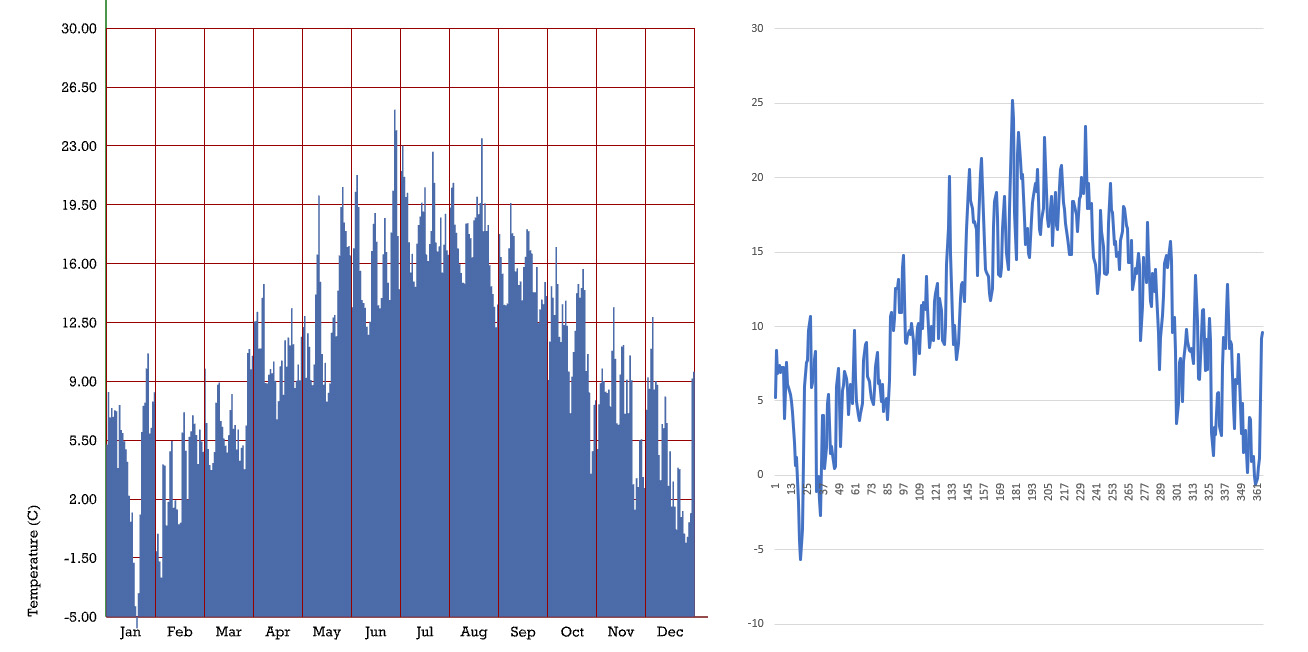
I would like to display a chart of daily temperatures as a polyline, and not as a mesh of columns: here are two examples:
- the first on the right I did with ladybug, and the only thing that comes close to what I intend to get,
- and the second on the left is an example in Excel of what I would like to achieve in ladybug.
Is there any way to do this in ladybug? That would help me a lot!
Thank you,