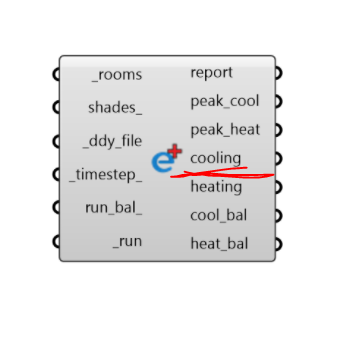
I understand that the ReadHVAC component gives me the results from EnergyPlus’s sizing calculation, i.e. it is based design days defined in the DDY file rather than the EPW file.
I have noticed that it outputs values for each room separately. If I want to get the peak load for the whole building, is it fair to just sum up all those values like this:
One would expect rooms to have their peaks at different times of the day (east-facing rooms earlier than west-facing rooms). Therefore, by summing up the values like I do above, I’m worried that I’m getting an un realistically high overall peak load.
You can look into the EnergyPlus documentation and output files for different HVAC templates to see how the peak loads are actually aggregated to size specific supply system equipment.
In general there are two types of methods: Sum-of-Peak (or Peak) versus Coincident (or Block) loads. The Sum-of-Peak load is calculated by taking the sum of each zone’s maximum hourly (aka peak) load, while the Coincident load is calculated by taking the maximum of the total building load per hour (sum of all zones per hour):
\text{Sum-of-peaks load} \text{ } [W] = \sum_i^m{max(\vec{Q}_i)}\\
\text{Coincident load} \text{ } [W] = \max(\sum_i^{m}\vec{Q}_i)\\
Where we have m zone load profiles [\vec{Q}_1, \vec{Q}_2, ... \vec{Q}_m] with \vec{Q} = [q_1, q_2, ... q_{24}] a vector of 24 load values in W.
As you suspect, the Sum-of-peaks method is typically overestimating sizing loads by ignoring when the loads are occuring in time. The only exception that I know of are constant volume systems since they must provide the maximum load for all rooms simultanously. The Coincident/Block method is what you want in all other cases, since it efficiently accounts for the potentially big difference in zone loads per hour. This reflects the sizing demand of variable systems, since we can “vary” the supply energy based on actual hourly zone demand.
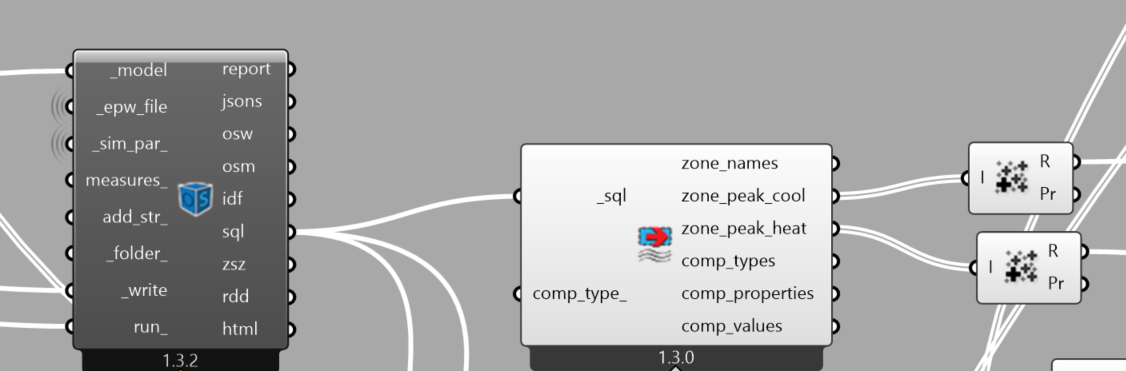
Thanks @SaeranVasanthakumar for that detailed explanation. Do you know then how to get the coincident load in LBT? I assume the values coming out of the peak loads component are the peaks for each room individually?
The cooling output is a list of the “combined cooling demand of the rooms at each simulation timestep” (from component description), so you just take the max from that for the Coincident load.
The output that Saeran pointed to is a correct way to get that timeseries data so that you can find the coincident peak. If you want to use the “Model To OSM” component to run your simulation, you can also get this timeseries design day information by parsing the data in the zsz.csv file with the HB Read Zone Sizing component.