Does anyone know how to input ENVI-met receptor via grasshopper? (looks like there in no ENVI-met’s receptor feature in dragonfly grasshopper)
I want to use ENVI-met to record hourly temperature and relative humidity in a certain point. Previously I have used ENVI-met and set receptor feature in ENVI-met space. But now, I am confused how to use receptor feature via grasshopper in order to extract hourly data of some variables in a certain spot. Or, maybe there is another way to record hourly variables produced by ENVI-met via ladybug (by put reference point in visualisation to record the data)?
Yes, I confirm, “receptor” object is not available yet. But I can add it on plugin roadmap.
I use directly “Results reader” and “Results viewer” of old version of plugin written in Python - called lb_envimet - for now. These components let you visualize and retrieve results of analysis grid point by point. Lb_envimet
I have planned till March 2020 for now. For other improvements, I have to understand well how next release of envimet will be.
You can find details here: ReadMe dragonfly envimet components
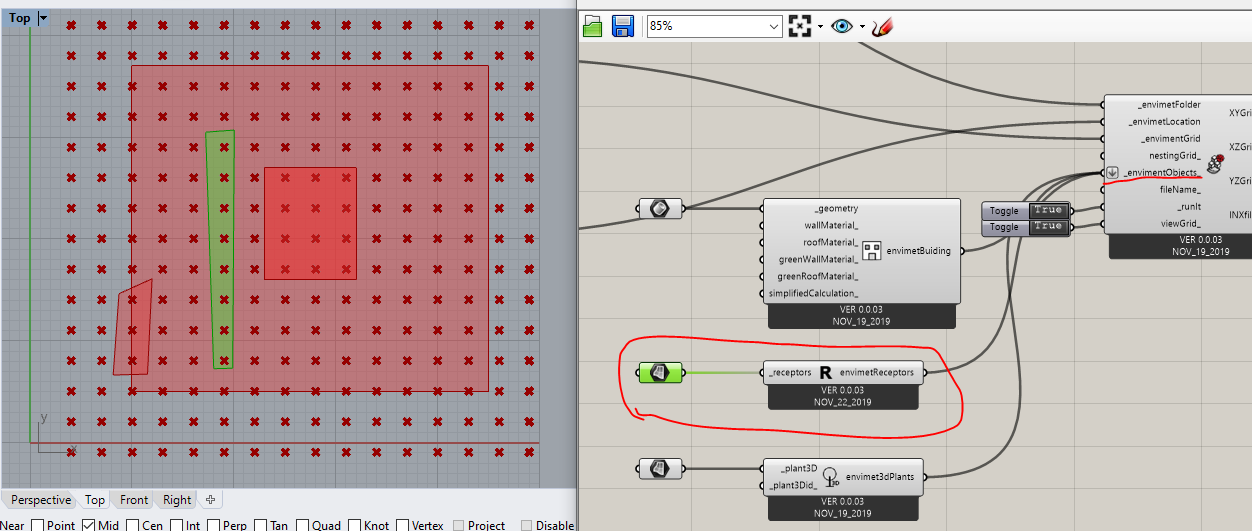
For now, I can add receptor after creating inx file via grass hopper (inx file open automatically after I set true in ‘DF Envi met run INX’). After saving the inx file with receptor, Then I can run the simulation normally in grasshopper by loading the folder address.
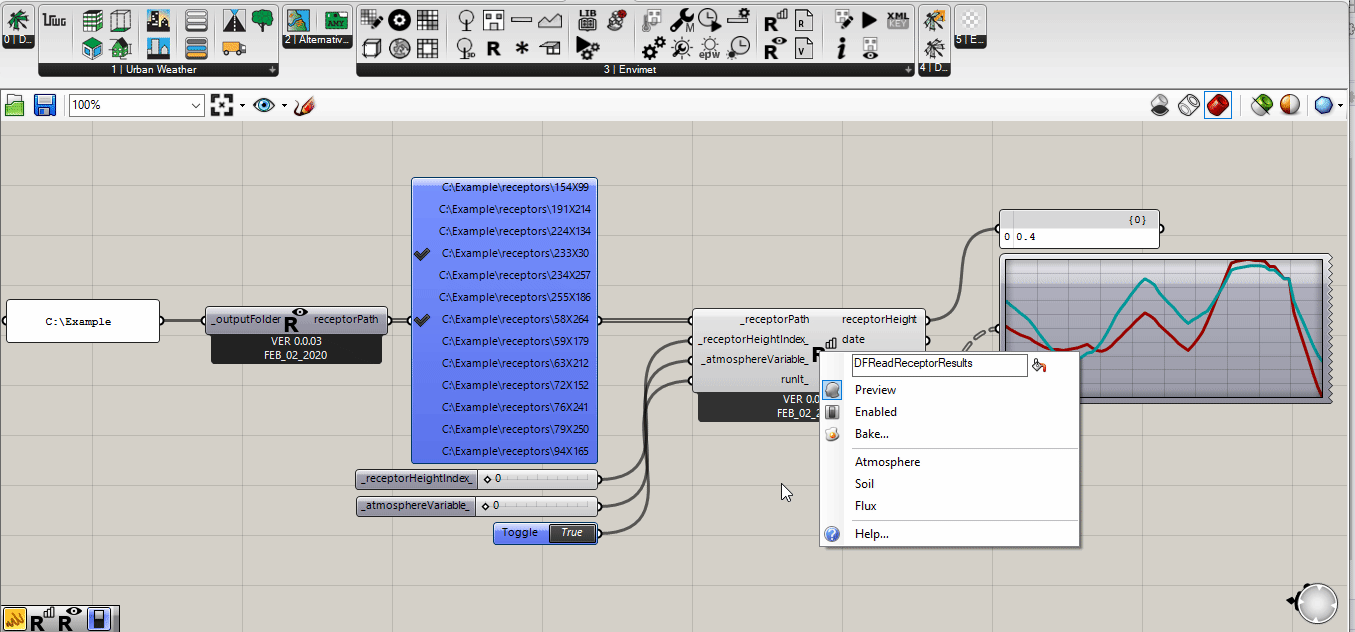
The receptor output can be seen in output folder - the output is within receptor folder namely ATM or SOIL (.DT) . Normally, I open receptor output (.DT) in CSV format so I can filter and see the results. I hope in the future development you make (next year), the receptor output can be filtered and seen via dragonfly in grasshopper. It will be interesting if the filtered data in receptor can be visualised in a line chart via grasshopper (e.g. hourly air temperature and relative humidity). This is helpful to compare and see local microclimate variables change due to vegetation or any objects effect in each receptor spot. Anyway, that is just my idea since I have used ENVI-met a lot for my paper and found some difficulties in extracting output data from receptor.
Thanks for your response and I really appreciate your work.
Good news! I have written Modeling part for Receptor faster than light, it is in beta release which you can find here: DF Envimet components - beta
Once it is tested enough by me and other users I will move it in official release.
You can use a basic surface like this to set them:
You do not need to type ID. It is made automatically by a concatenation of coordinateX + “X” + coordinateY.
You can find it here, in the beta plugin version: Receptor reader!
If you do not have important ongoing task with Dragonfly envimet components you can try it. Otherwise you should replace manually some components in your old workflows.