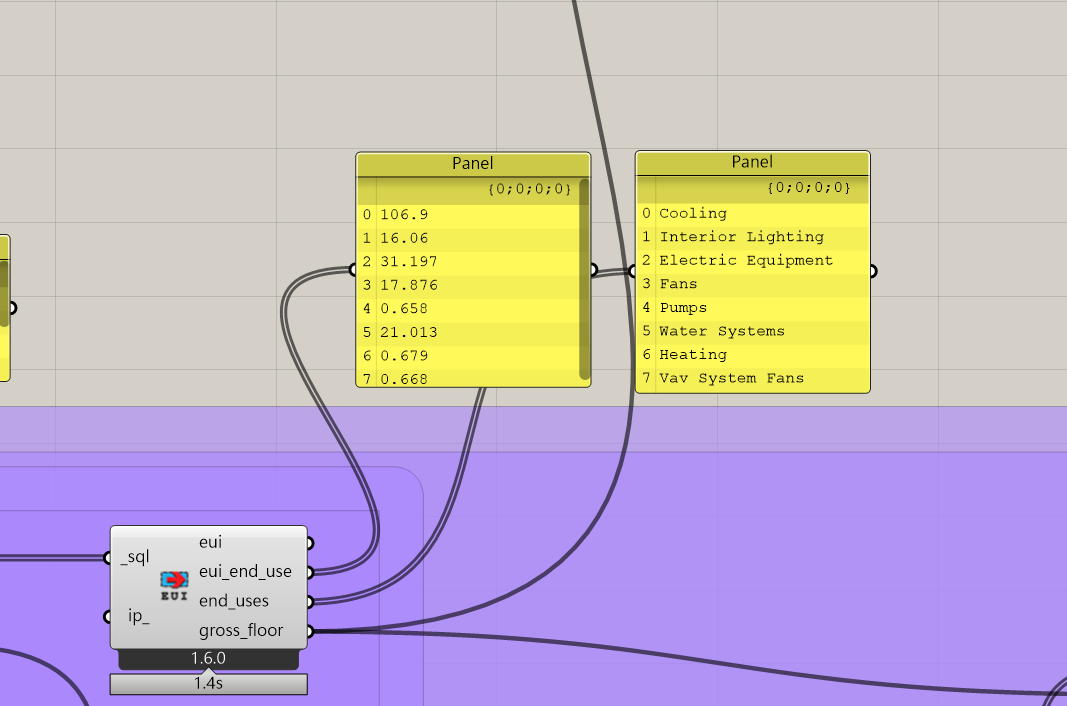
i would like to plot a chart, where y-axis is EUI in kWh/m2, x-axis is the catagory of end use. therefore, how can i plot it, thanks
There are a few Grasshopper plugins that can do that. You can also use the Grasshopper native plugin to create the bar chart that you have in mind.
would you mind to tell me which GH plugin has this function?