Btw, is there a way I can use python to represent the results? Like showing the 3D model of the room as you did or showing the heatmap?
Depends which environment IDE you’re coding in. If you’re using Jupyter you could use something like:
Thanks Antonie,
I use Anaconda. Are you familiar ?
Sorry my bad, should have used the word IDE  Anaconda manages your python environment (like whether you use python 2 or 3 and which 3rd party libraries you have). Jupyter is an IDE for you to code in. You can install it by running
 pip install jupyter lab and once that’s done try jupyter lab. I won’t go any further with explaining how it works as they have a good documentation website which you can fawn over 
1 Like
Is there a way to convert the analysis grid into an analysis mesh in order to visualize in Grasshopper? I am using GridBased to run the analysis. Only thing I am missing is that after I finish the analysis how can I get the analysis mesh?
@mostapha @AntoineDao
If you have access to Grasshopper then you can generate the grid from inside Grasshopper and use it in your workflow. Why do you even use the libraries outside GH? It will be easier and faster for what you are trying to do.
There is no built-in solutions but as @AntoineDao said you can use other libraries to create one. Also you can use this online viewer developed by @TheoA. 
https://www.ladybug.tools/spider-rad-viewer/rad-viewer/r7/rad-viewer.html
2 Likes
Because I am using some simulations outside the GH environments, so it all mixes in python. Thank you Mostapha!
You can create the objects inside Grasshopper, write them to a folder (See the API docs), then run all your studies as subprocesses and get the results back in Grasshopper and visualize them.
Thanks Mostapha, but I guess it is hard to do it there because my simulation engine is python (using some optimization tool). So I need to do all things on python. I am facing a trouble accessing the x y coordinates of the test grid and the actual lux values… What functions can be used? Would eventually need to get for each test grid value the x, y and lux value. Thanks very much Mostapha!
Is it worth you pointing us to a repository where your code is so we can get a better idea of what you’re wanting to achieve? It’s quite difficult to help directly without actual code and it’s always great to see how these things get used out in the wild
1 Like
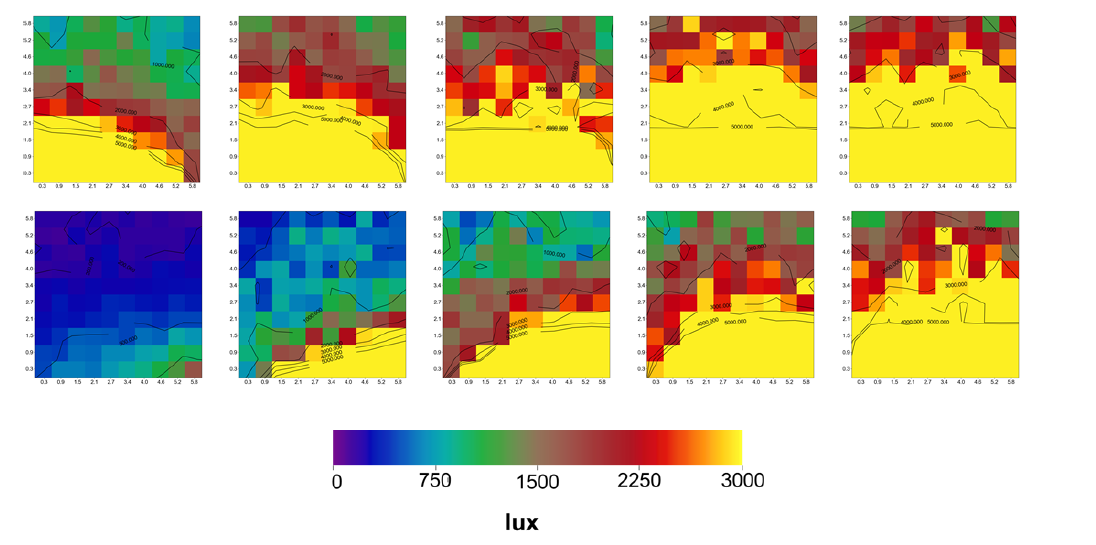
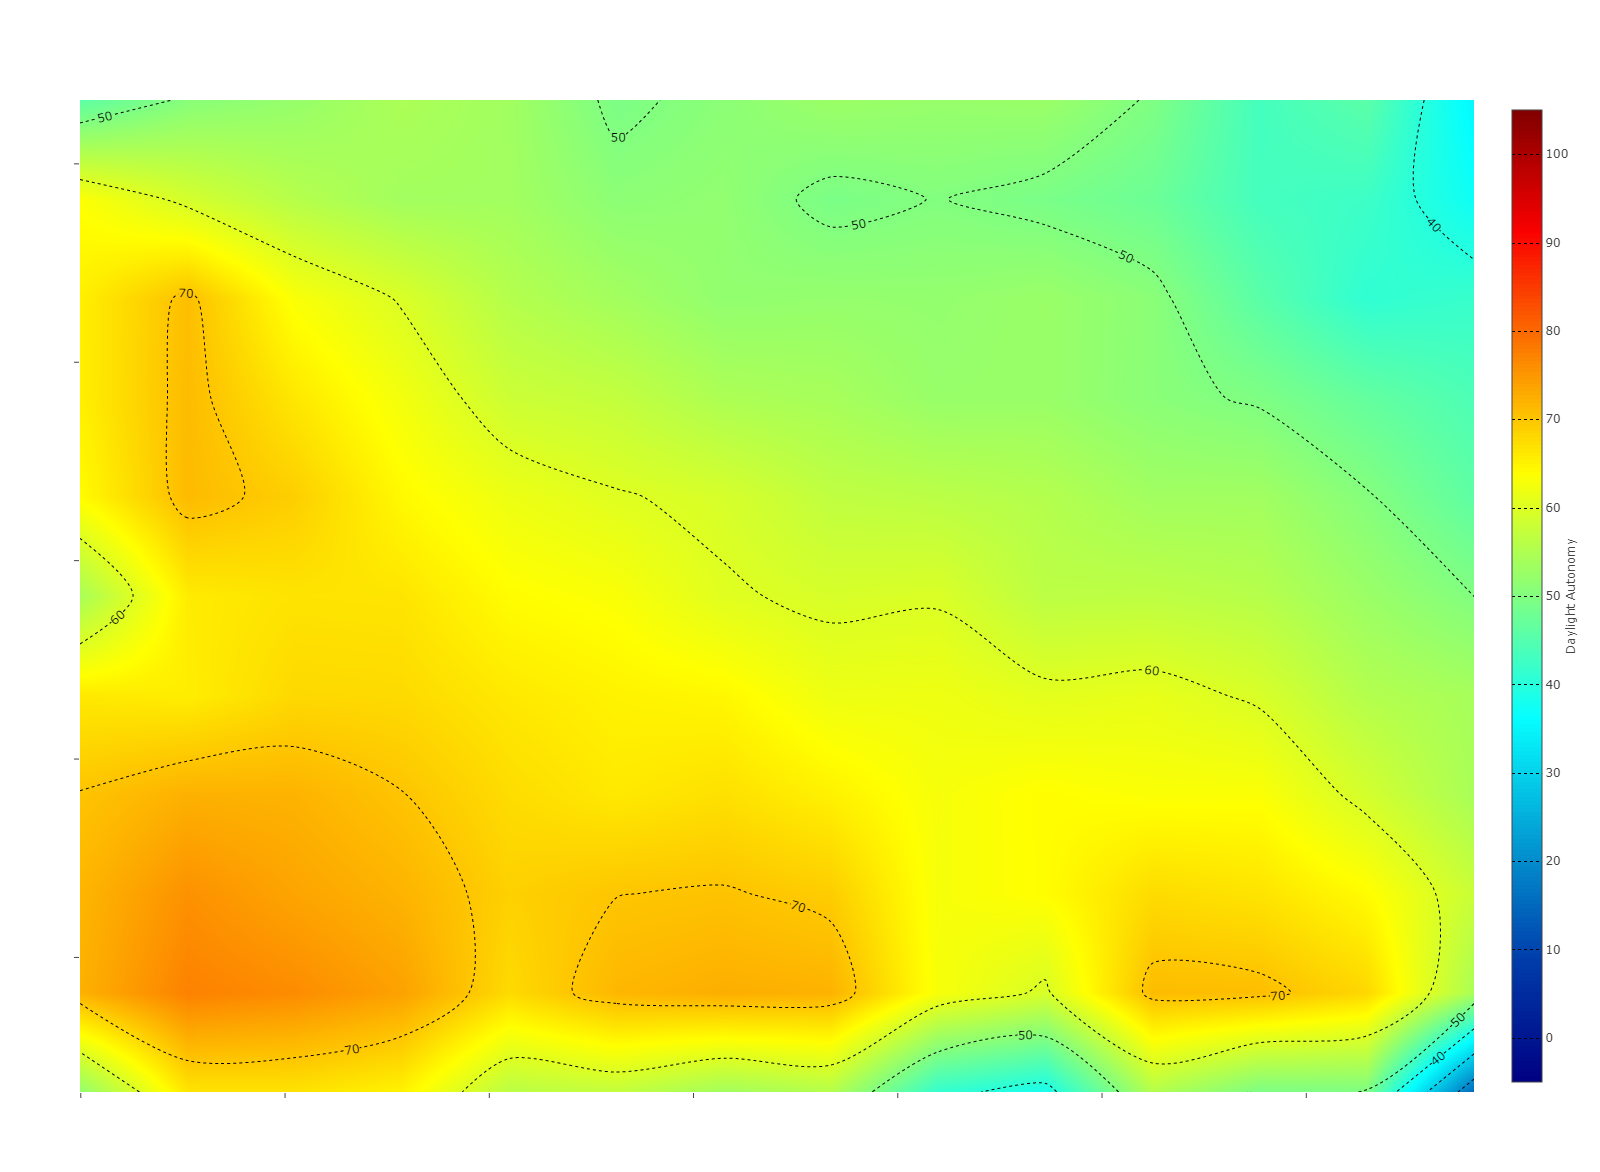
If you just want simple plots, like the one below, you can use Imshow from matplotlib.
If you want to get fancy, you can use vtkplotter or mayavi. I have had some decent success with vtkplotter, but it gets buggy when there are a lot of mesh faces to color:
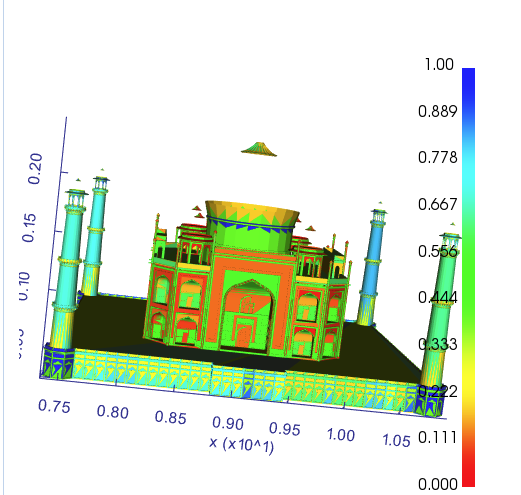
(This was all done a year or more ago, so I don’t have the code snippets that I used to create the plots)
3 Likes
Thanks Antonie,
Here is what I am trying to do:
Basically I have not learned to use Grasshopper as I came from a non-architectural background, but I am developing an algorithm on python to generate several schematic design options, and for each I want to run a light simulation and get an evaluation metric based on the lux values. Due to the large number of layout options I am generating, it would be more handy to do all that analysis on python. So to be able to evaluate the lighting and get a value I wanted to access the location of grids and also the lux points.
So when do you need to visualize the grid? If you are listed looking to process and compare multiple grids would you not aggregate the values of each point in a grid (as an average for example) and then compare the grids numerically? Also, if it is only 2D plots of grids you want then the options shown above should do the trick (matplotlib or plotly).
1 Like
That is what I am doing, just wanted to make it more fancy but I guess after being able to access the points I can do it  thanks !
Fancy == More work. Be lazy my friend
1 Like