Hello everyone,
I’m not sure if this feature was added to Honeybeetool recently, but last time I checked a few months ago I wasn’t able to create heat maps to visualize annual glare values. So I wrote a custom component that can create heat maps of all .DGP files you have in a folder (including its sub-folders) that the user specifies.
Here is a link to the component, I would love to hear your feedback!
The component is under the “linked data tab”
https://www.researchgate.net/publication/320234813_Is_computer_programming_beneficial_to_architects_and_architecture_students_for_complex_modeling_and_informed_performative_design_decisions
1 Like
@RaniaLabib Could you show me some picture and the result of your component?
I’ll post some pictures shortly. A picture of a heat map and an early version of the component (I modified it a bit) can be seen in the conference paper in the link above.
1 Like
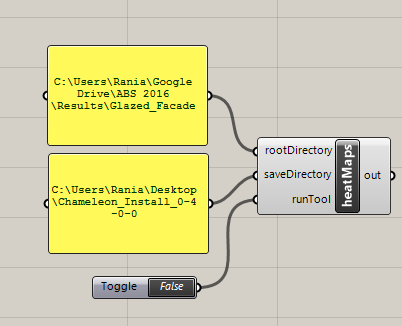
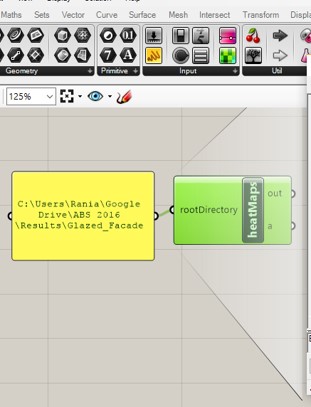
@MingboPeng My computer is in repair and I’m using an old computer that I have at home which doesn’t have Rhino installed. So I can’t post a picture of the updated component. The updated component has two user inputs ( the source folder, and the target folder), where the component in the conference paper has only one input (source folder).
Below is a picture that I have of the initial component and a heatmap produced. I will post a picture of the updated component when I get my computer back.1|311x407
I finally got my computer back from repair. Here is a pic of the updated component. 
I’m mistaken, you can create heatmaps in HB. However, I needed a custom component because I had over 400 DGP files that needed to be visualized., it would’ve took forever if I used HB to create them indvidually. By the way, the maps are interactive, meaning that when you hover over a point on the map, a pop up appears that shows the DPG at this hour.
2 Likes
Hi Rania,
The rar file seems to be damaged/broken. Can you please share again. Thanks.
@SaketSarupria so sorry for the delay. I’ll update this and post it here soon.


