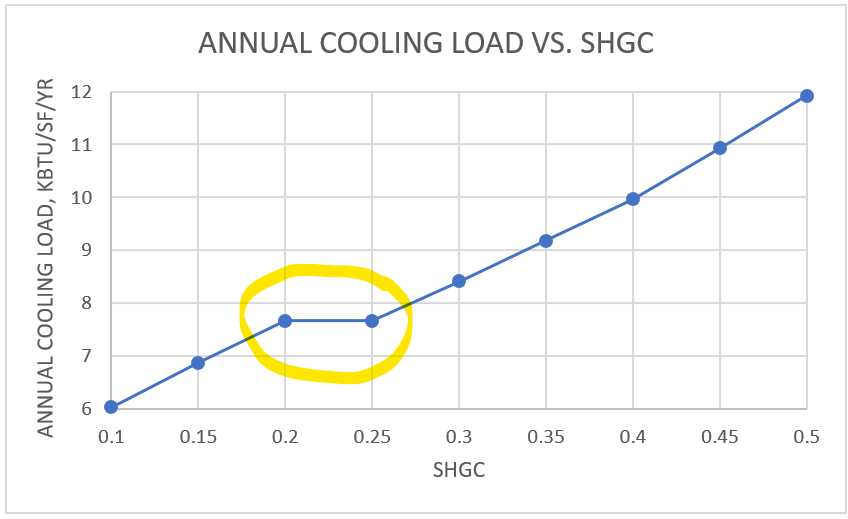
I am trying to run a simple analysis to show the impact of SHGC on annual cooling loads. The results were showing that as the SHGC increased, the annual cooling load would increase linearly (as expected) - EXCEPT from 0.25 to 0.30 SHGC. The attached chart illustrates what I am talking about. I tried a lot of things - and kept getting this result. Full disclosure: I am not an Energy Plus wizard.
I have the ventilation air set to 0 and the economizer turned off because I wanted to see total zone cooling loads without any contribution from outdoor air.
I attached a very simplified GH file (sorry I couldn’t figure out how to embed the epw file and too big to upload here; I am using the San Francisco International Airport TMY3 epw file.) I’m at a loss for what could be causing this. Any advice is appreciated! Thanks so much in advance.
(FYI - my Rhino units are set to inches and yes I understand that is bad form  )
)
SHGC Analysis Test Example.gh (582.0 KB)
@MariaGrimm,
It might be your surface convection. As the solar radiation heats surfaces, convection at the surface will vary with temperature, temperature difference, and changing air properties (amongst other things). Specifically, this might be a case of the exterior/interior air films in your glazing layers heating up non-linearly and resulting in a non-linear cooling load.
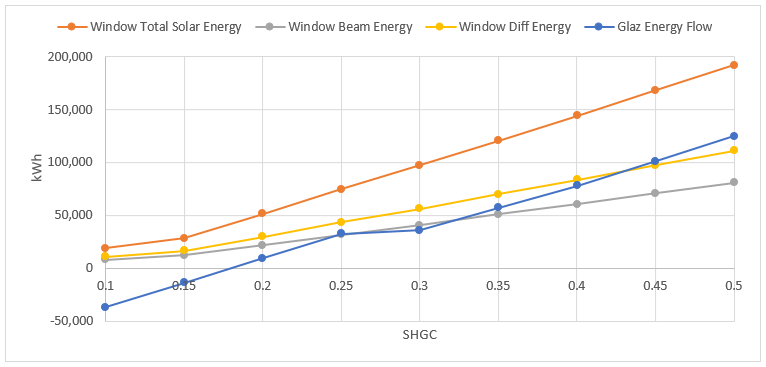
Try plotting the sum of the Window Beam Energy and Window Diff Energy output with the Glaz Energy Flow against the same SHGC changes. Both of these outputs are in the Read EP Surface Result component. That way you can separate out the radiation from the conduction/convection in your windows, and confirm if the former is linear and the latter is not.
S
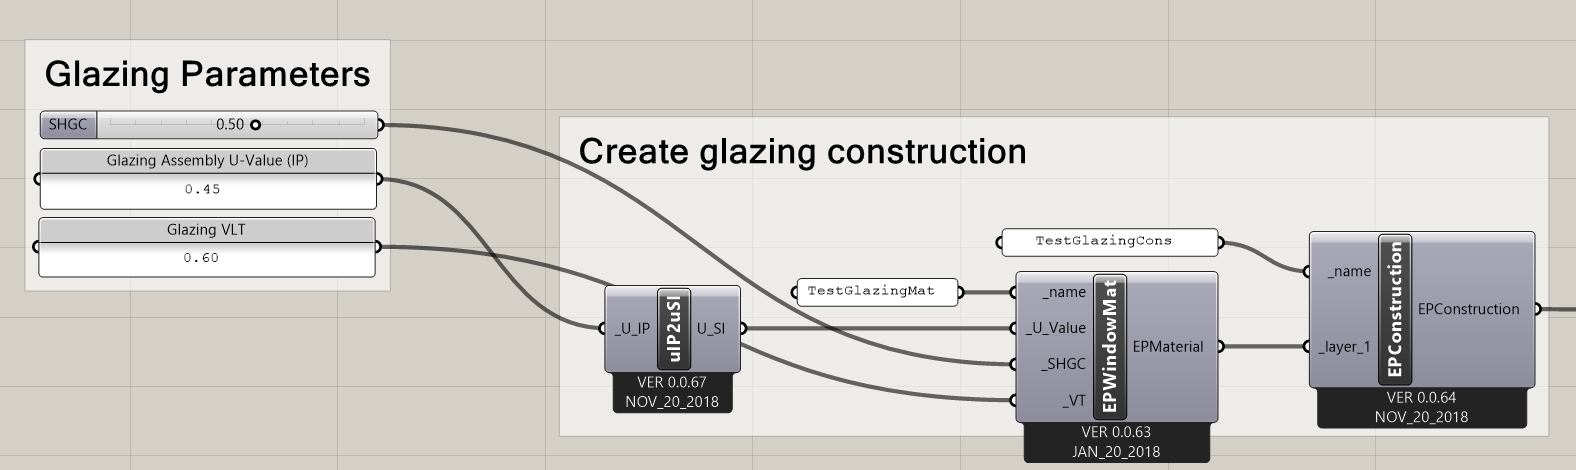
Thanks for your response. I plotted these glazing surface variables - it’s definitely the Glaz Energy Flow that is driving these strange results. Do you have any advice to make this not happen? I am using the EPWindowMat to define the construction.
@MariaGrimm, cool! So we can confirm the non-linearity is occurring due to the conduction-convection at your windows.
Do you have any advice to make this not happen? I am using the EPWindowMat to define the construction.
I don’t think you want to “make this not happen.” The non-linearity isn’t an error, it’s a reflection of the way the increase in SHGC impacts the conductive-convective heat transfer differently from your radiant heat transfer.
I don’t know why it’s happening specifically, but think it might be due to EP using different convective coefficients based on different state thresholds reached during the simulation (i.e velocity) - similar to how convective coefficients are derived in ASHRAE Fundamentals. This is a simplified way to model changes in fluid density in relation to the window temperature profile, which in turn impacts the velocity, boundary layer characteristics, and heat transfer at the window surface. But, this is just a guess and it could be something else.
You can look into different ways of modeling surface convection in EnergyPlus, if you want to modify the assumptions behind the convection modeling used in Honeybee, although this requires advanced EnergyPlus skills.
Thanks @SaeranVasanthakumar - I appreciate your feedback.
I’m definitely not an advanced EnergyPlus user. I’ve done dozen of studies using IES-VE where we test various glazing SHGC values to understand impact on cooling loads & energy… and usually we are dialing into that range of 0.25-0.30 SHGC (what we see in many high performance glazing products that we use.) I’m trying to do more quick parametric analysis in HB with EnergyPlus… but I can’t really present results that show reducing your SHGC from 0.30 down to 0.25 has zero impact on cooling loads… this sounds like it may be more complex than I had hoped.
@MariaGrimm
You’re right, it could be some overly aggressive assumptions from EnergyPlus that is causing the issue. I noticed that you are using the EPWindowMaterial to model your window, which uses the EnergyPlus SimpleGlazingSystem[1]. As the HB component notes, the simplifications made in this model result in only approximate results for window energy flow, in part due to the simplification of using a single number (SHGC) to model different types of solar heat transfer. This might be what’s responsible for the conduction-convection lag in your 0.25 - 0.3 range.
You might get better results by constructing a detailed window object by combining the ‘HB Glass Material’ and ‘HB Window Gap Material’ objects. You will need to make some assumptions, (or gather more information) to convert your SHGC to the more detailed window properties it requires (transmittance, reflectance, emissivity) but I think it’s worth testing to see if it gives you a better model of what’s happening at the 0.25 to 0.3 SHGC range.
- https://bigladdersoftware.com/epx/docs/8-1/engineering-reference/page-044.html