Illuminance Annual vs Grid data

Hello, I have a question for this two analyses, a brief information of what I did:

I’m analysing a room in Abu Dhabi with a 20º of orientation from the north.

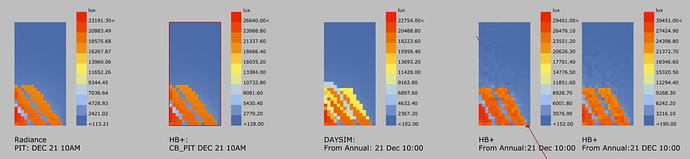
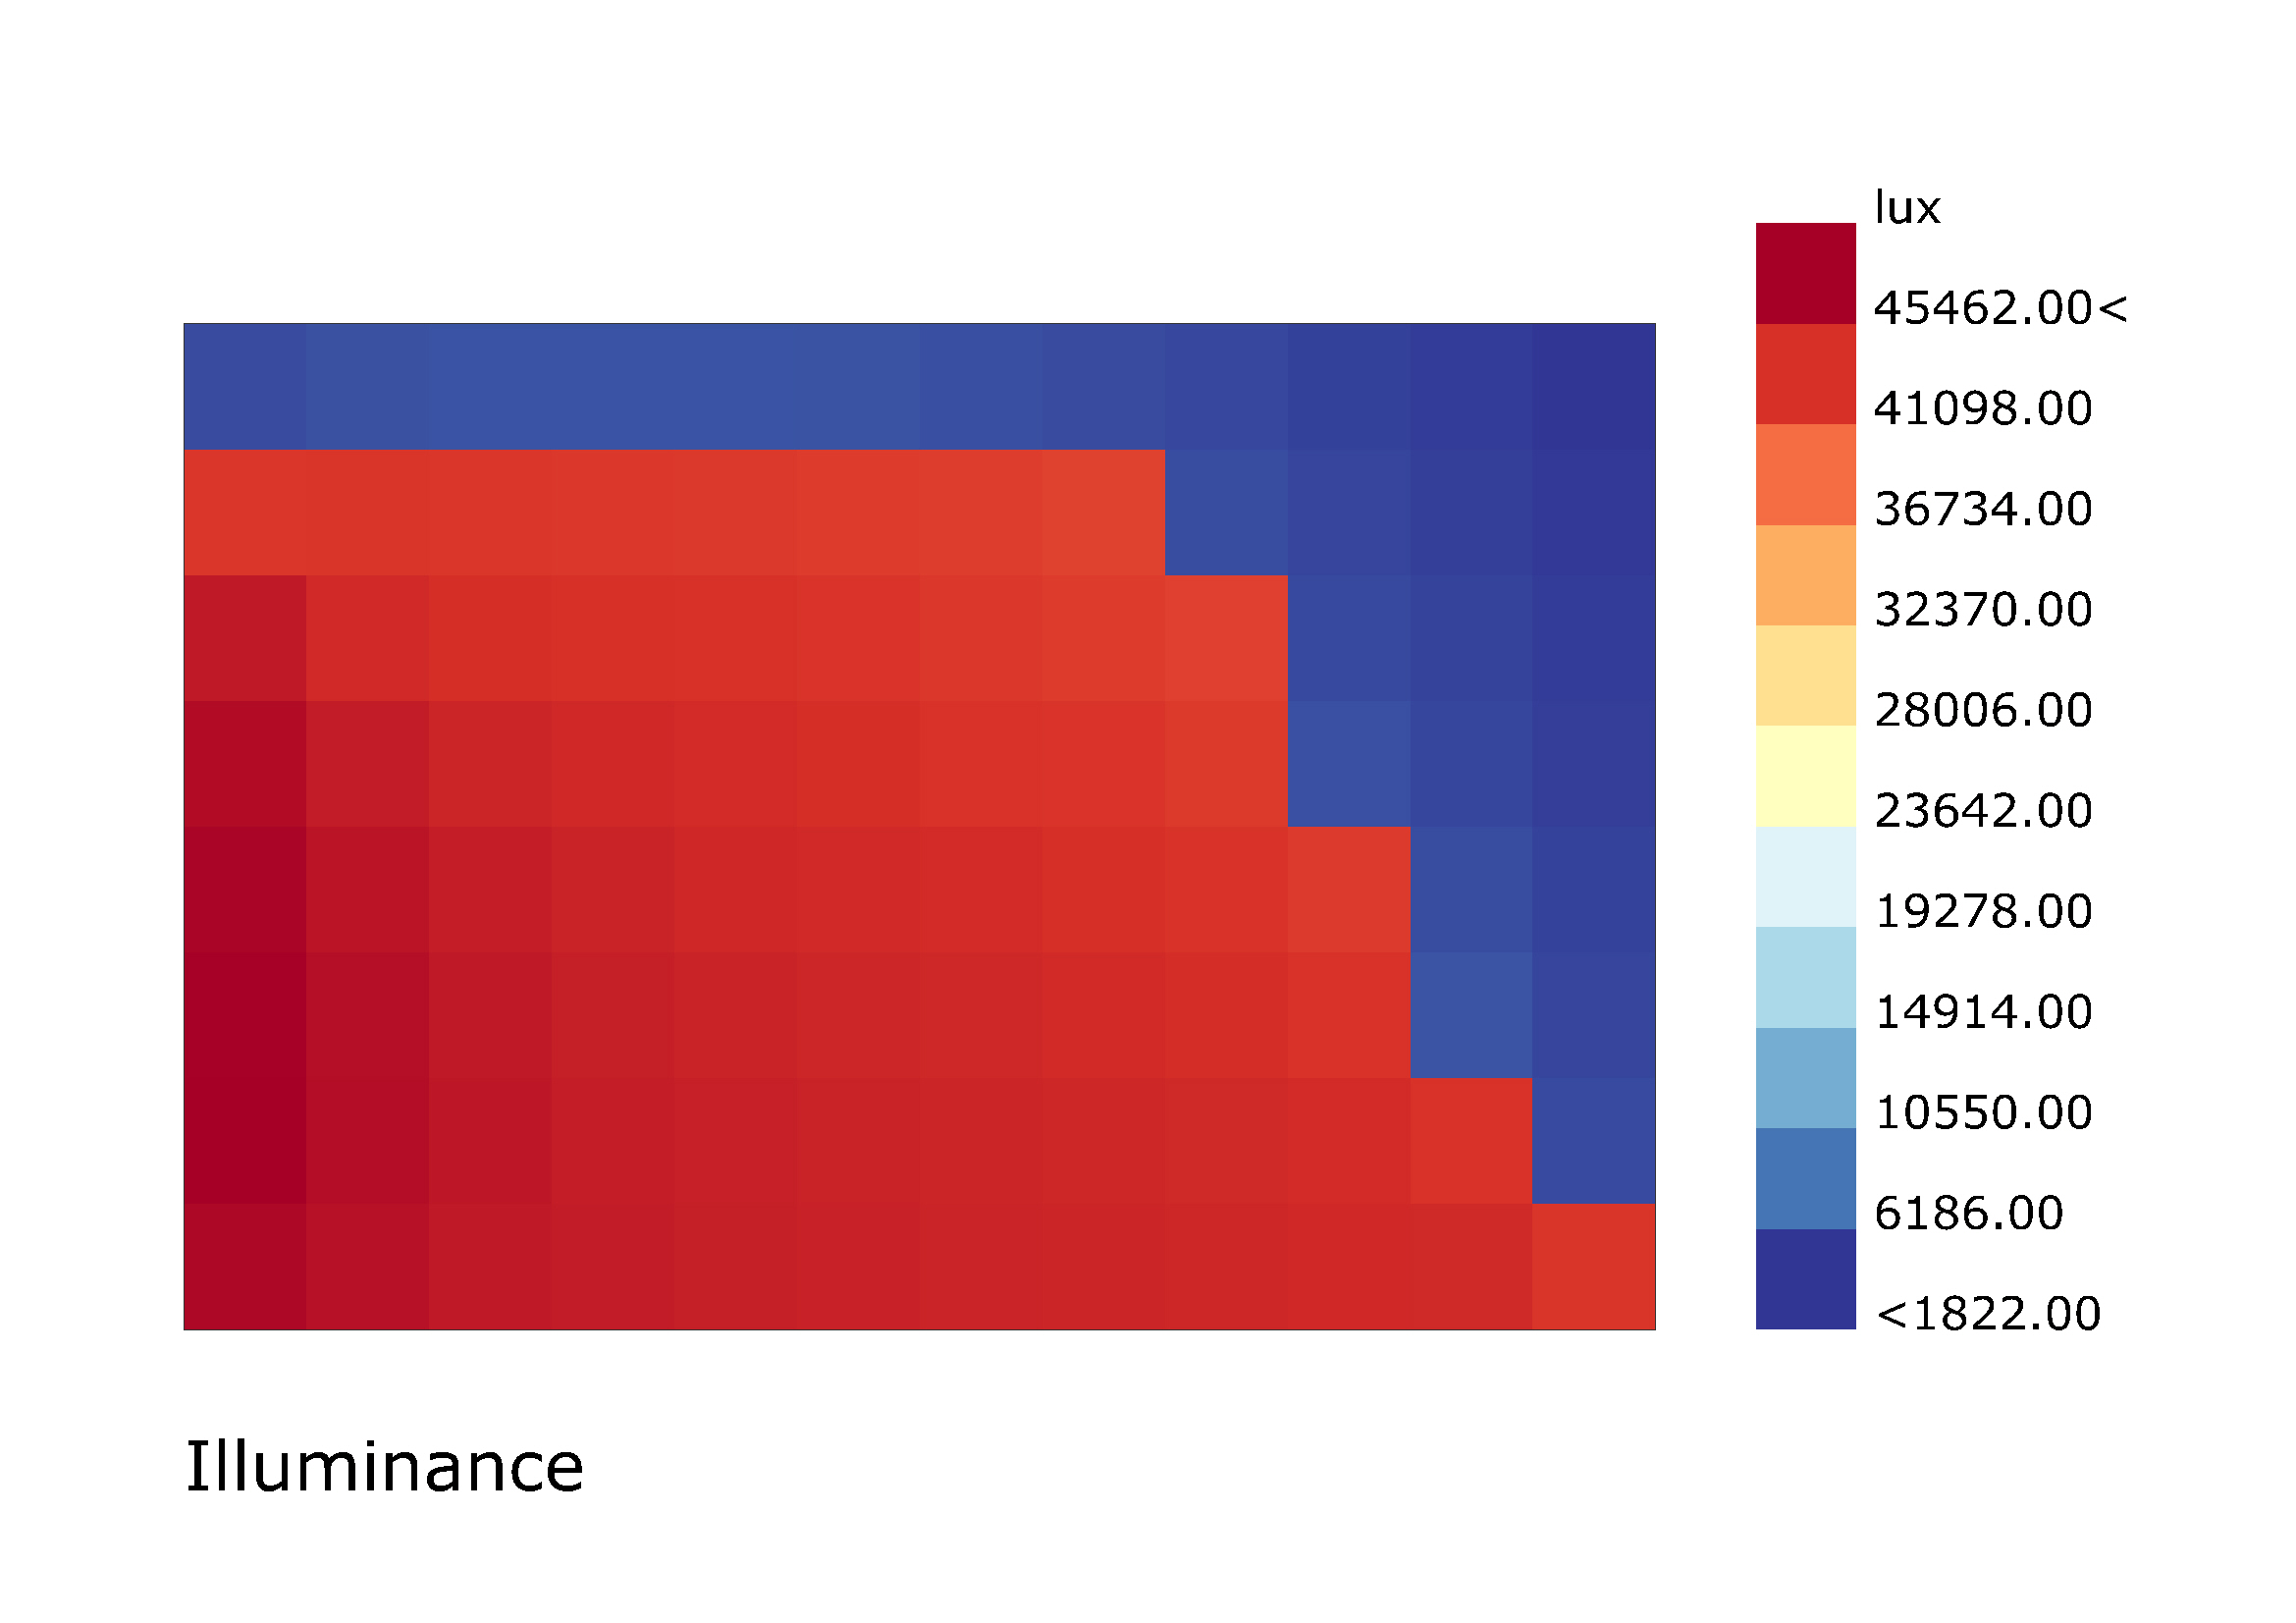
On the grid based, I’ve all the data of January, 20th at 12:00, which will be this one:

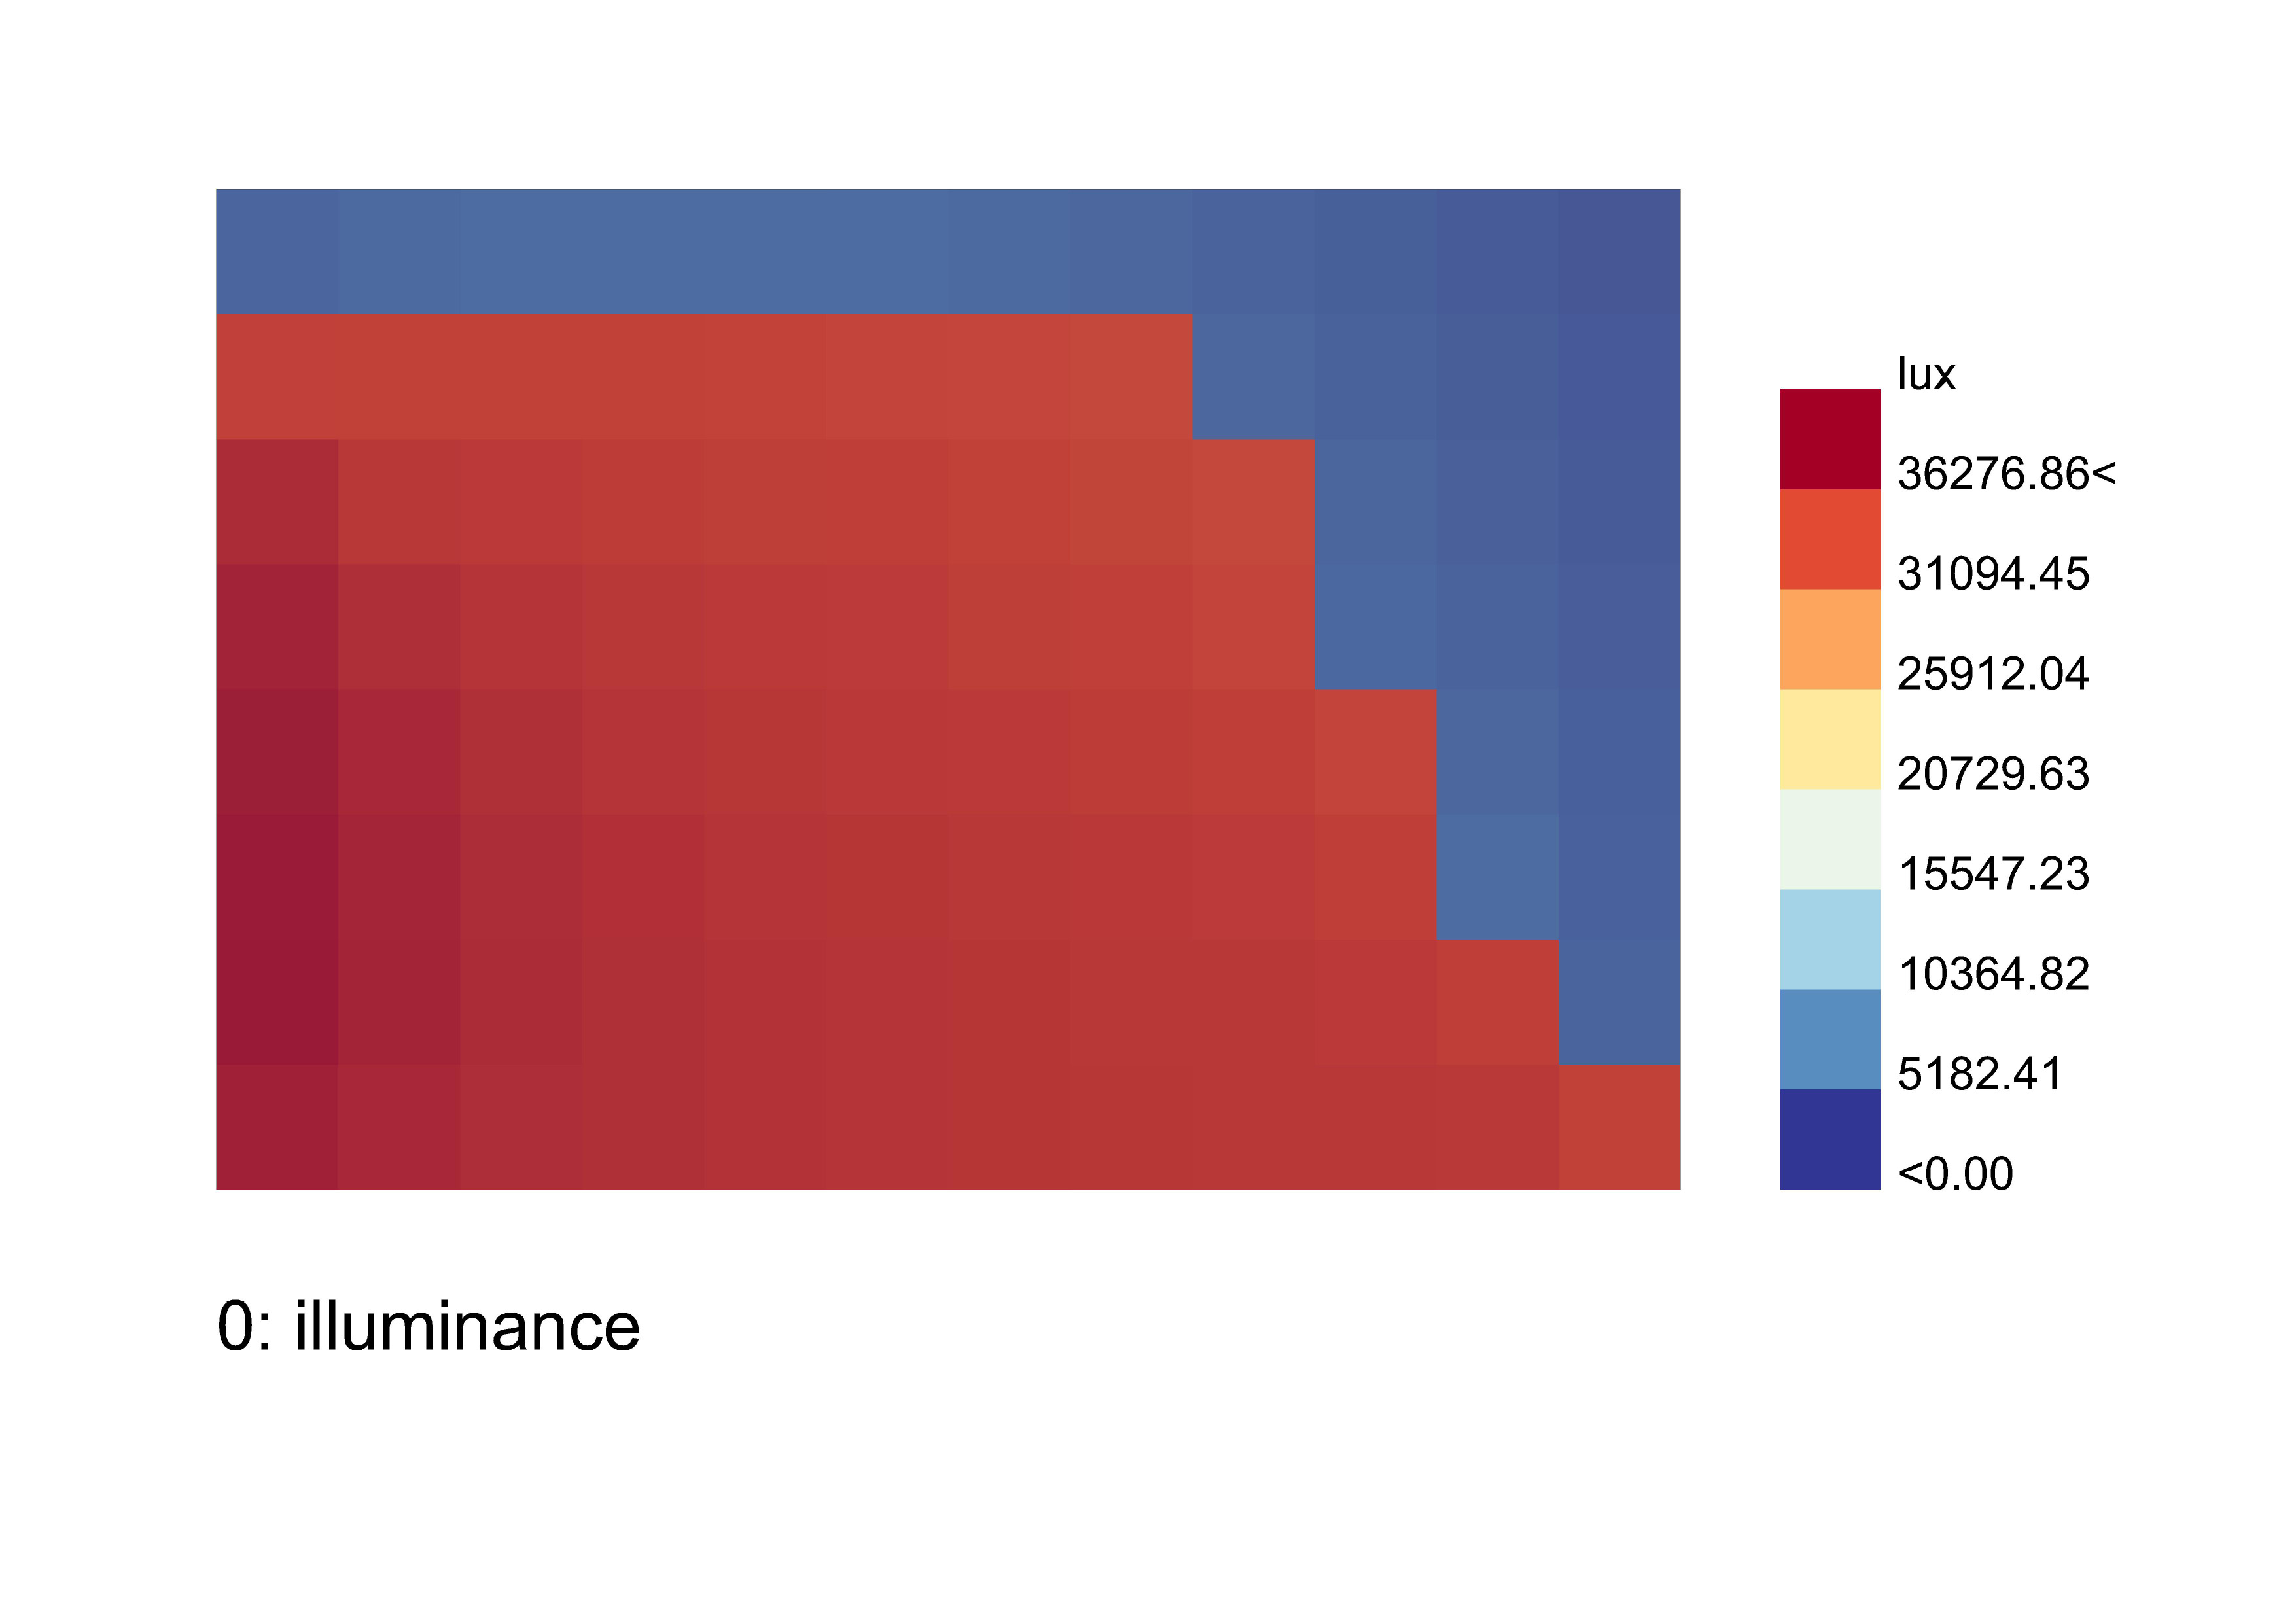
So here we can see that the maximum is 36276 lux


Moreover according with this analysis my point number 62 has the value of 33068 lux

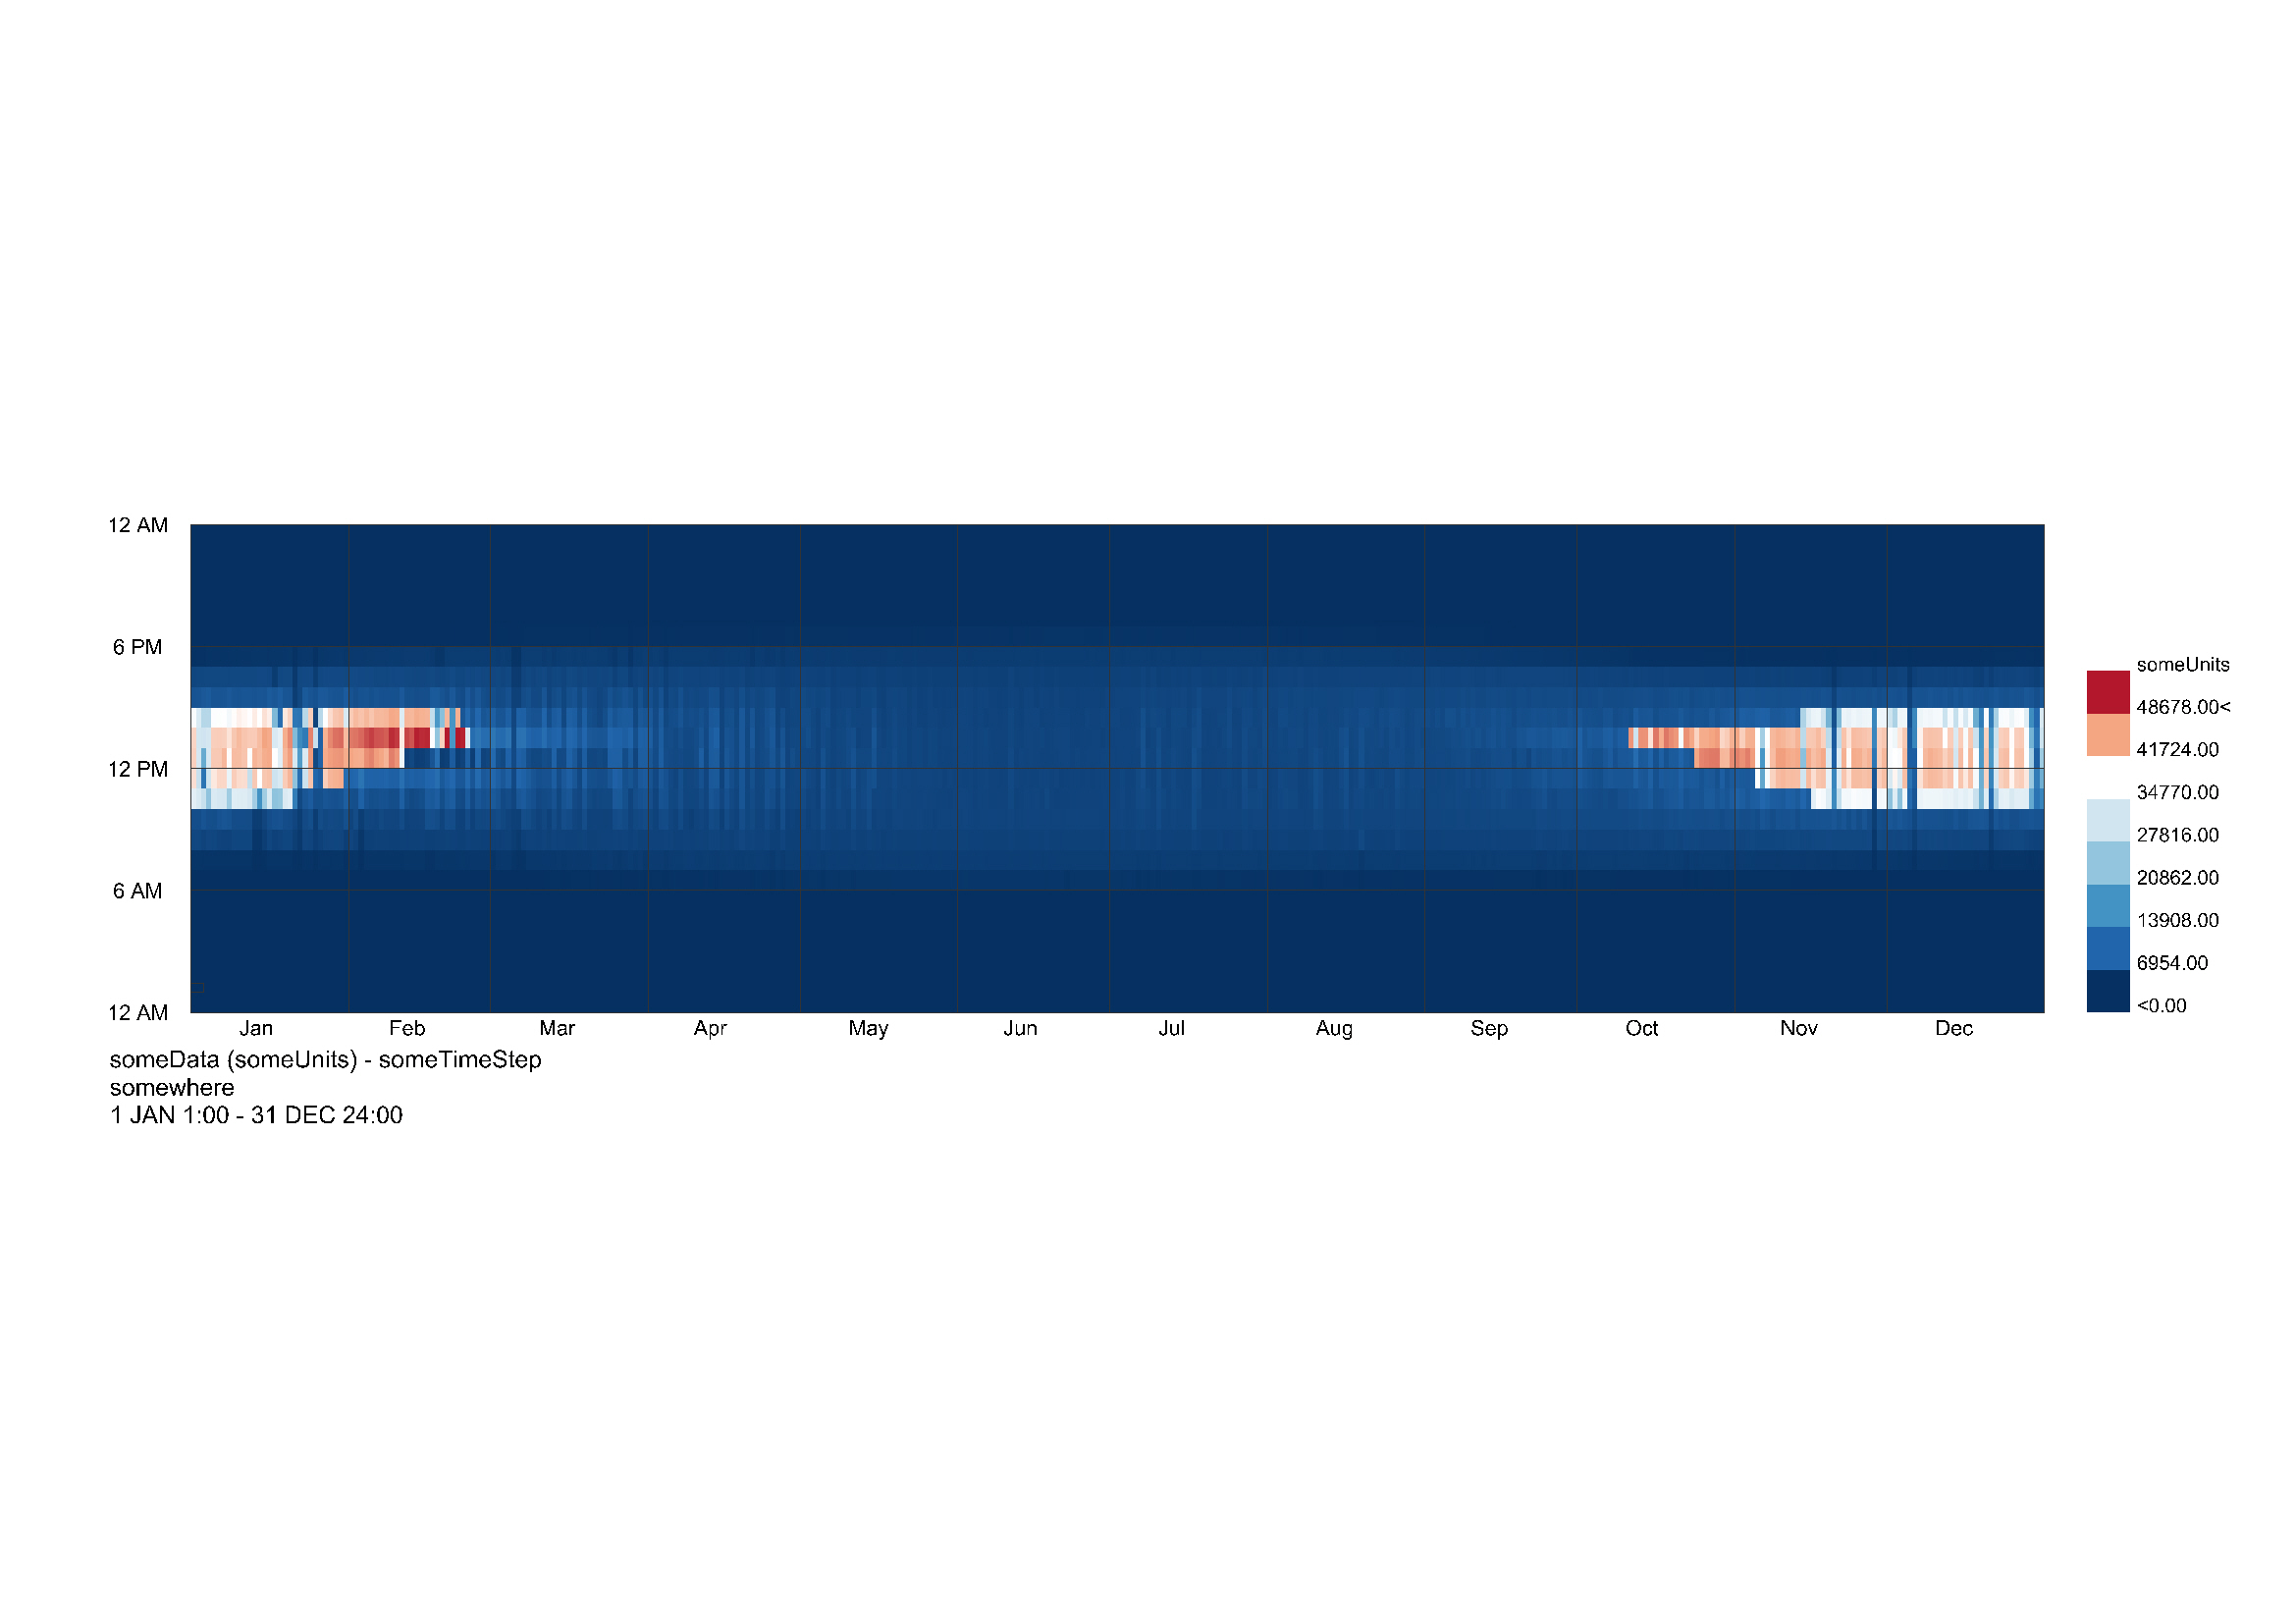
Now… for the annual analysis I put my sensor on the point 62 and run the analysis and this is my graph:

As you see the maximum is 6765 lux, way much lower than the maximum of the grid based.

So the 33068 lux of the grid based should be somewhere on the annual graph I am correct? So the values should be higher or otherwise the values of the grid should be lower.

But I just don’t understand where is the error or maybe the logic which I’m reading the values is not correct, as I understand the annual uses Daysim and grid uses Radiance, so which result is the “good” one, because the difference is quite a lot.

Here is the GH file, hope someone can help me with this doubt and thank you in advance.

Grid_Annual_Illuminance.gh (566.6 KB)

@sarith can write about this more elegantly but here is some details that you need to know about Daysim (which is used for annual daylight modeling in the Honeybee legacy) versus Radiance which is used for point-in-time daylight modeling.

  1. The sky in annual calculation is divided into patches while the sky that is used for point-in-time calculation is continuous.

  2. Radiance sky uses the accurate position of the sun for calculating direct sun contribution while Daysim uses a simplified method which uses the closest sun from 61-65 sun positions.
    See this reply for more details: HB+, legacy and DAYSIM results - #4 by mostapha

The issue that you’re bringing us here is basically why we implemented radiance-based annual daylight simulation in Honeybee[+]. You can read more here about the differences on this Wiki page:

In short your point-in-time simulation is the accurate one and the annual simulation underestimates the direct sun contribution.

1 Like

Agree with @mostapha. The below image from the thread that @mostapha shared sums it up.

image

You can find more detailed info in the first couple of sections of this paper. Section 1 describes why the algorithm in Daysim is often prone to errors and section 2 details how we tried to mitigate this problem in Honeybee[+].

1 Like

Thank you so much for your replies, I checked out the papers and information between how Honeybee and Honeybee [+] and study a bit the difference of Radiance and Daysim, after I did again the analysis and these are the results:

Grid based January 20th at 12:00:
the point 62 is 41703 lux


Annual simulation:
where at 20th 12:00 we have 43948 lux

The values have more sense according to me, keep up the good working for the Honeybee [+]!