Hello,
I am relatively a newbie to grasshopper and honeybee.
I’m working on a (3x3x3)m box model with 40% WWR (south facing) for 3 different blind configuration (fully open, fully closed and partially open).
I wanted to know if it is possible to generate raw illuminance grid maps/points (grid spacing- 0.3m x0.3m) and possibly export it to an excel or csv file for 08am-06pm (hourly for 365 days)?
So, essentially I am supposed to end up with (3650hrs x 3blindconfig x (10x10) points) = 10,95,000 illuminance points.
Any ideas how I should proceed?
@sreejithjayaram93 According to your description,you just need 3 annual daylighting simulation using Honeybee or HoneybeePlus.
No… annual daylighting simulations produce an averaged out value for the illuminance points right? I’m looking at producing the illuminance values for each hour, which later on I will filter out with conditions I use in a spreadsheet software.
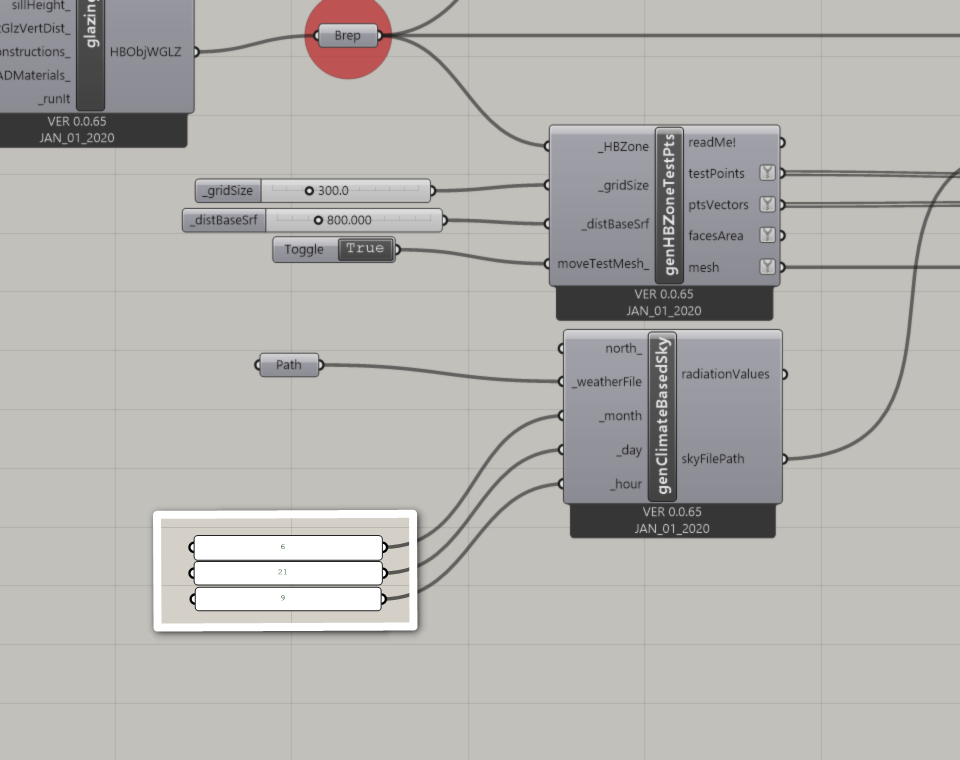
As you see, right now I’m able to produce a single point-in-time illimuinance grid map for June 6th, 9am. But I’m looking to produce the same for all 4000hrs (9am-6pm) starting from Jan 01 to Dec 31st.
@sreejithjayaram93 You can use Colibri in TT Toolbox. It can automated generate all case for your annual setting.

Some example:
Oh okay, will try it out and be back with an update. Thanks for the support!