Hi guys,
I am doing my thesis about glare analysis and I have some doubts about the results of image-based glare simulation with Honeybee+. Here are the descriptions of the simulation:
- The purpose of the simulation is to persuade the optimized shading area at a certain hour of the year (13:00, March 1st in this case).
- The method is that:
2.1 Find the line between the eye of the occupant and the sun at a given hour and find the intersection between the line and the shading area.
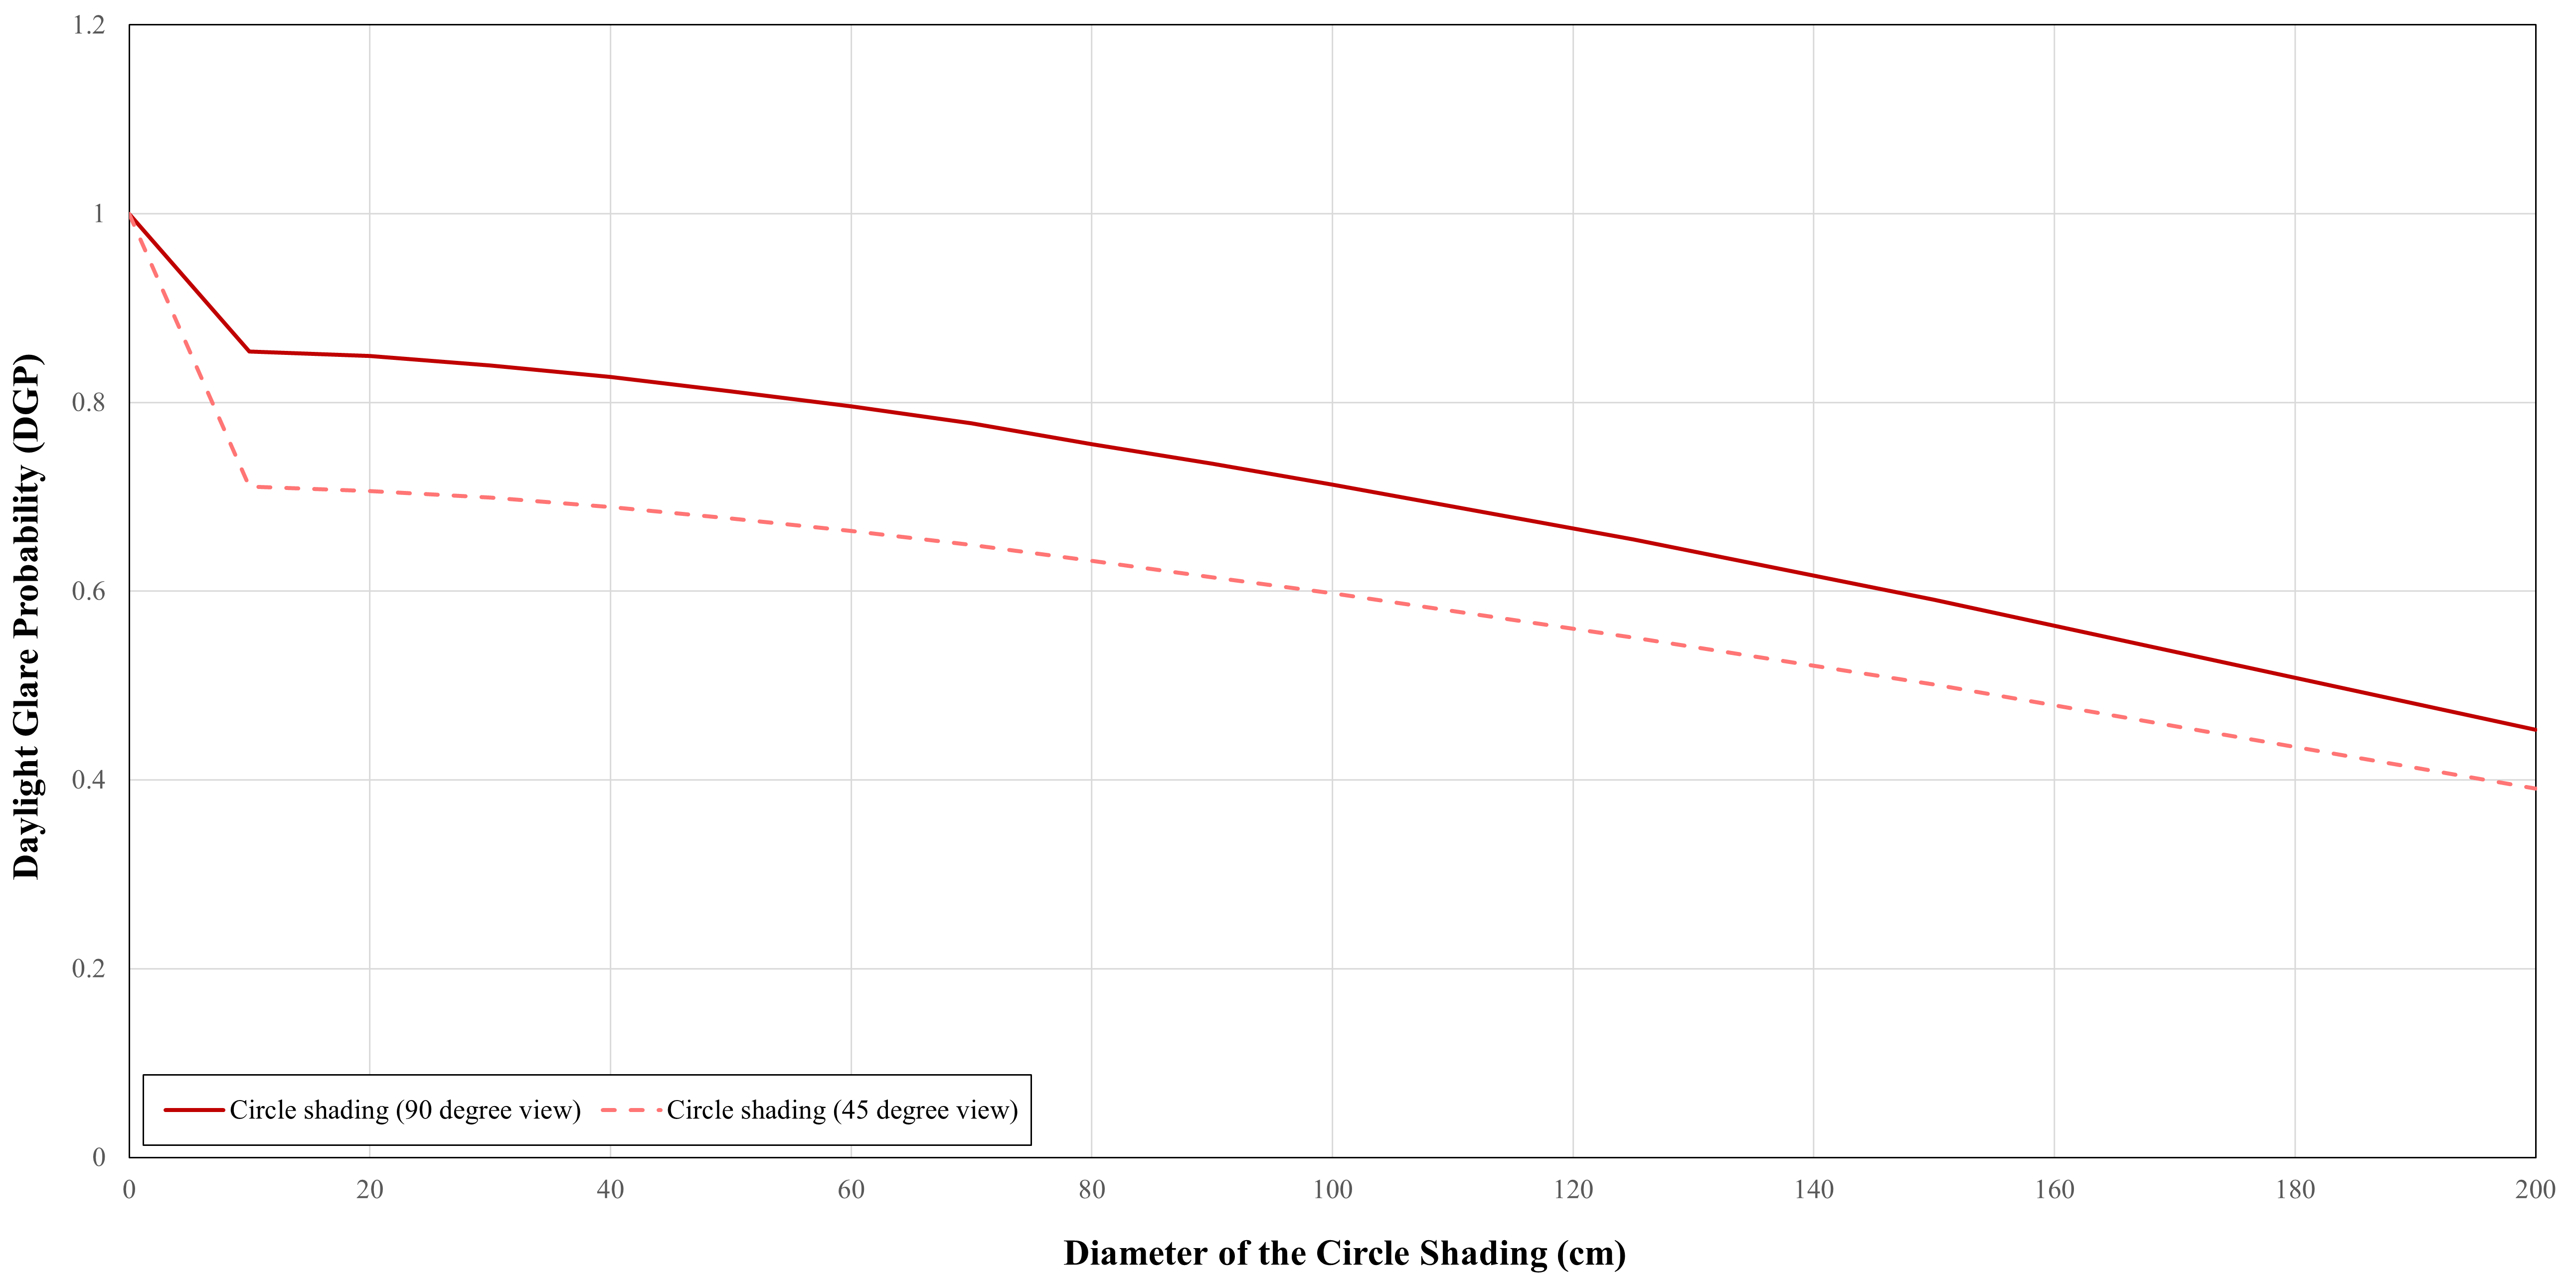
2.2 Having the intersection as a center of the shading panel, I got the results of DGP under different radiuses.
The attached picture shows the relationship between the diameter of the shading panel and the DGP when the occupant faces in the South and Southeast directions. I am surprised by how small the DGP values are changing. For instance, when the diameter of the shading is 140cm, the DGP is about 0.6 which is quite high and I think this doesn’t make sense. I am wondering if there is any setting mistake.
Please let me know if anyone has any ideas. Thank you so much.
Here are the Grasshopper file and the EPW file I am using.
DGP question.gh (627.4 KB)
ITA_Milan.160660_IWEC.epw (1.5 MB)