Reaching out to my colleagues in the LBT community. I am seeking advice about proper use of the PET Outdoor Comfort calculator. I wish to incorporate wind tunnel data into the calculation.
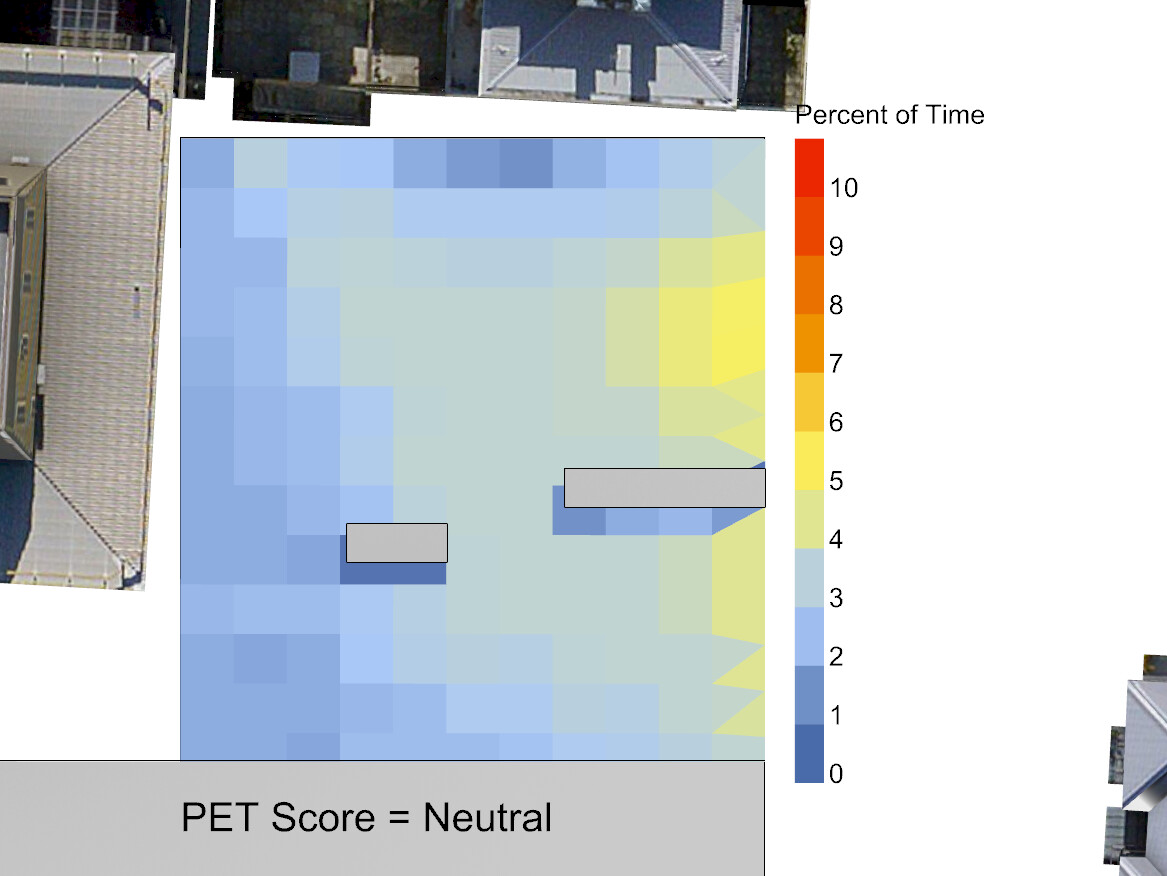
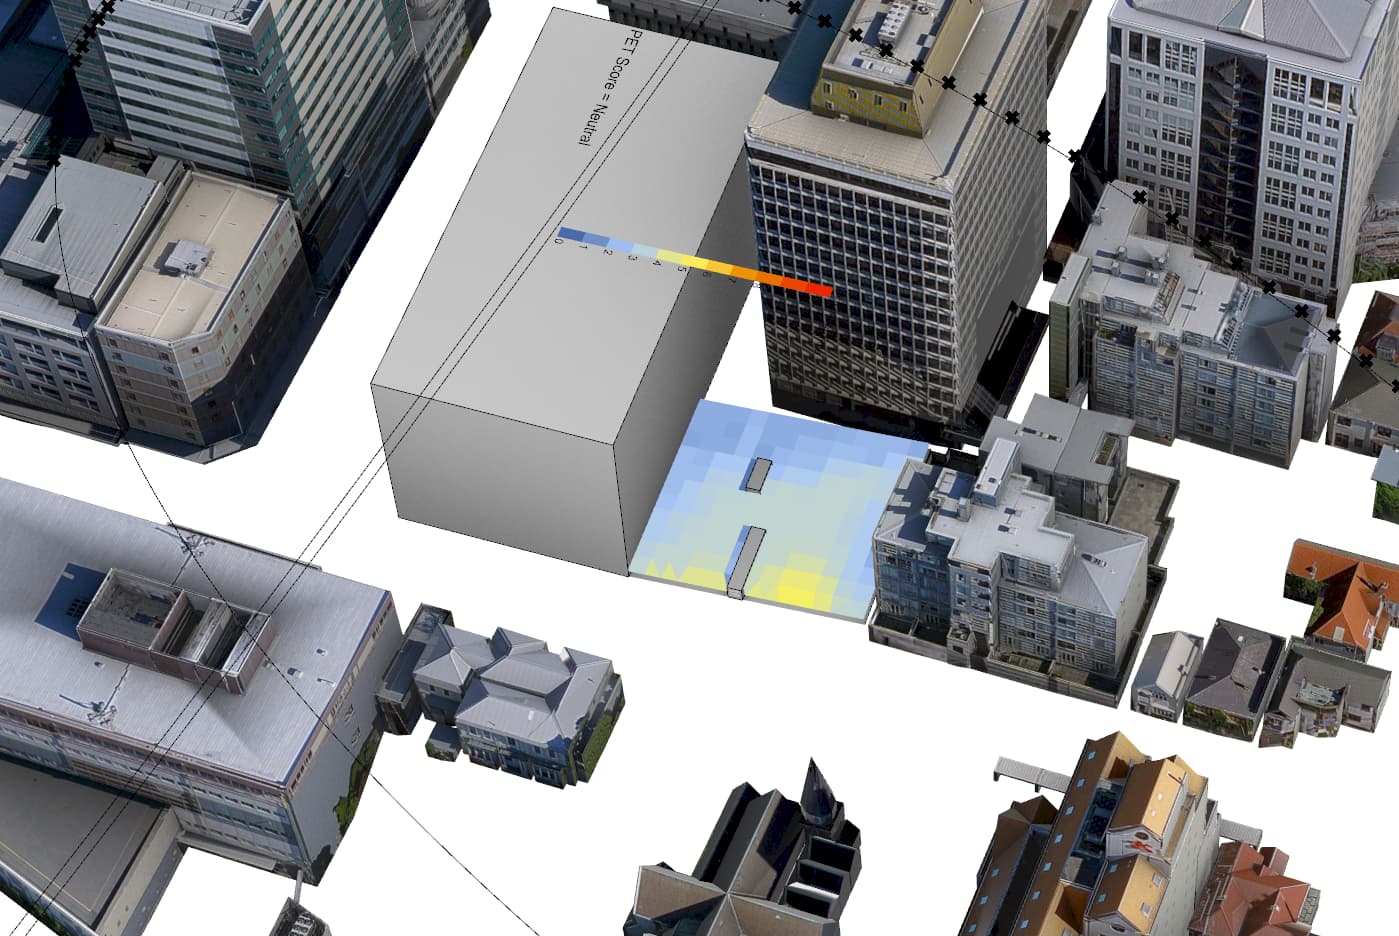
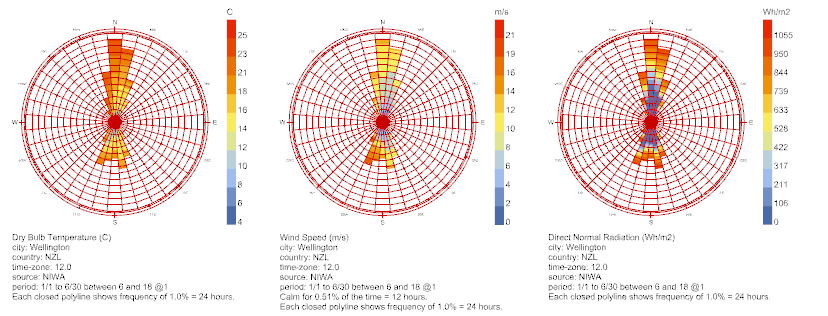
I am about to have 380 first year students use a script that plots the PET score across an urban space and to propose design solutions for the placement on the site of container as the base for an outdoor cafe. The system works, but I am feeding into it the local airport wind speeds - therefore wind at 10m above the ground (~2 x what is experienced by pedestrians) - and wind that is not affected by the surrounding urban environment. The PET comfort score is much more interesting in providing feedback to help students understand that “comfort” is dependent on exposure to the sun, wind and temperature AND what activity you are involved in.
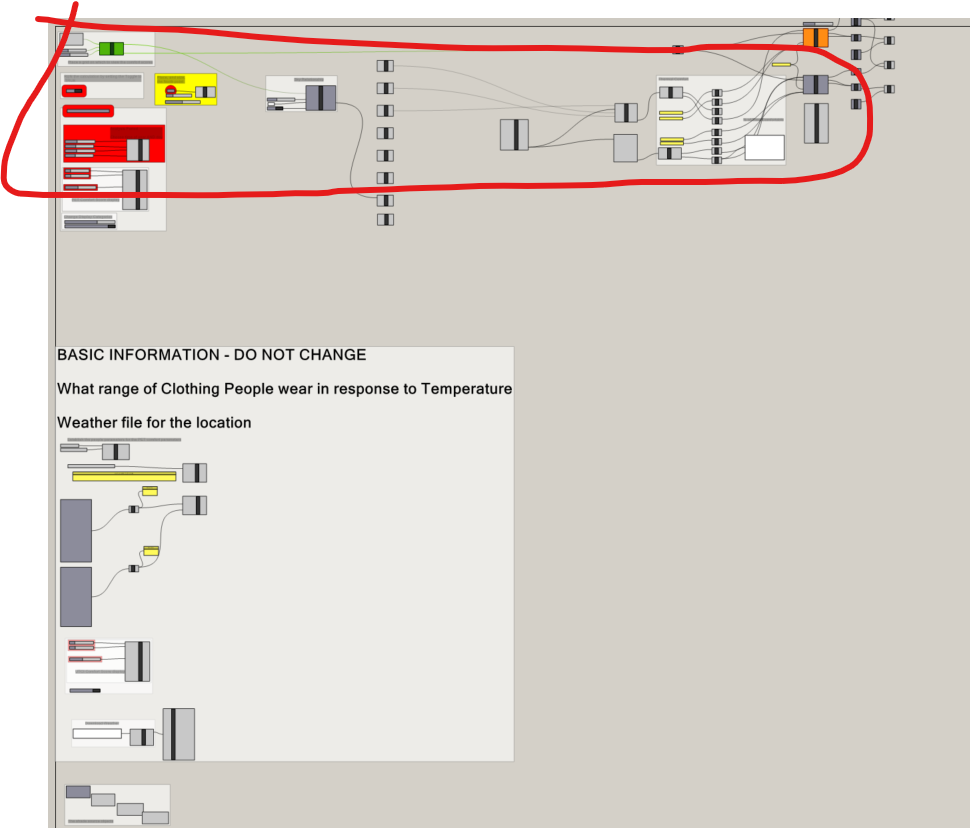
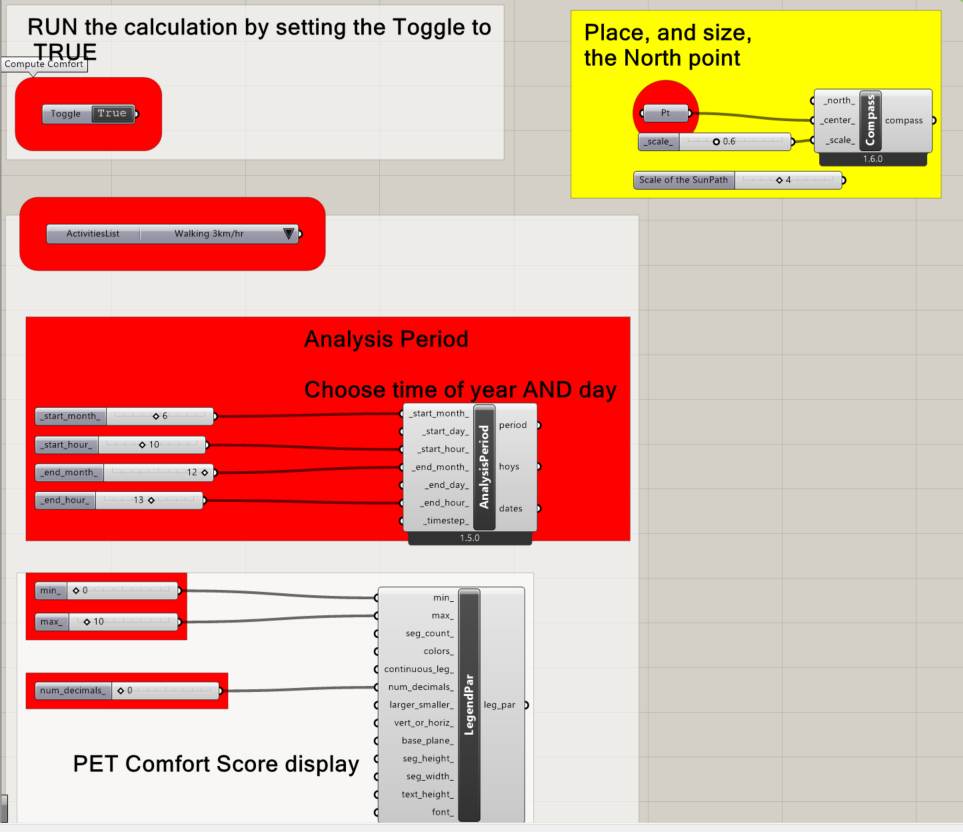
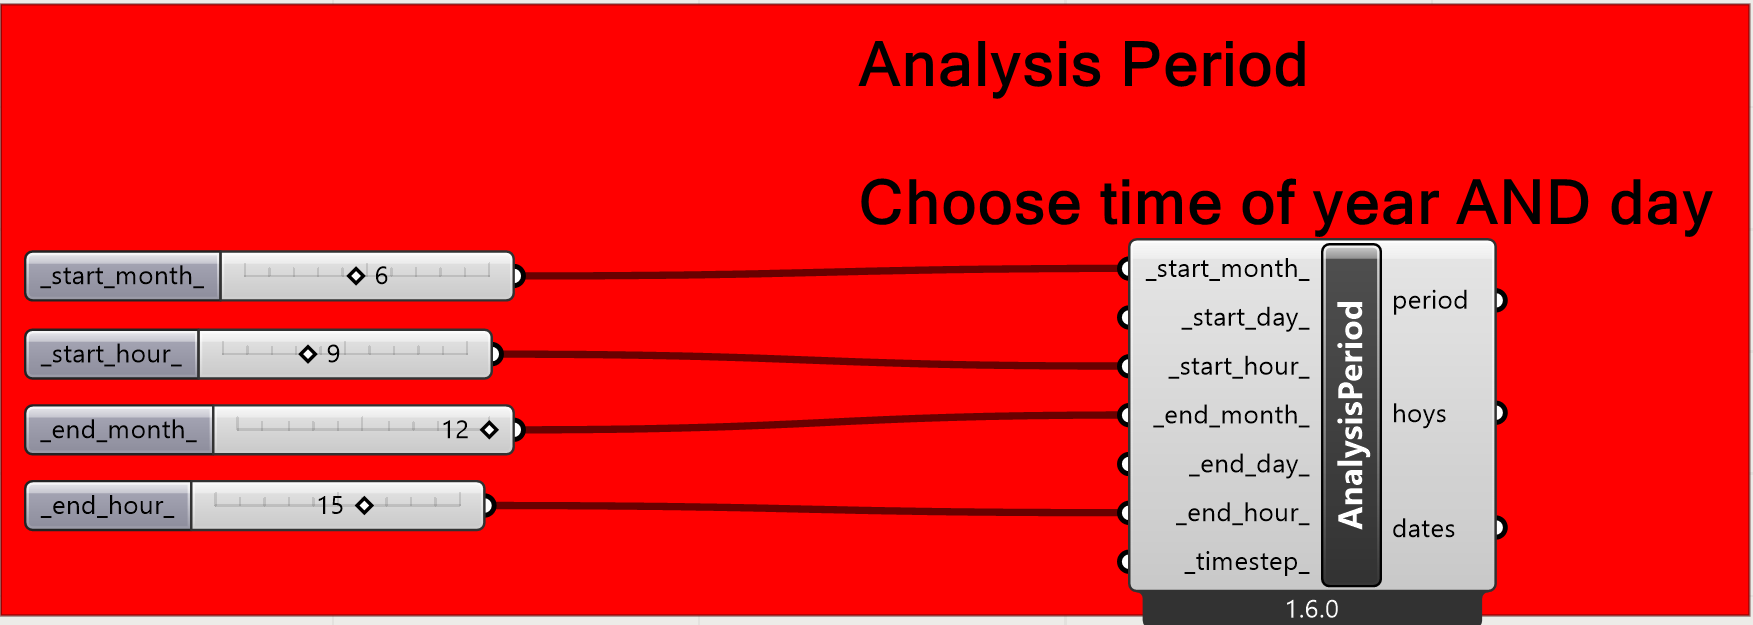
The script has a bunch of stuff I do not want students playing with but the (circled) PET calculation plus some simple data processing is intended to allow them to explore different times of the day and year and people’s activity level.
I have data for several key positions across the site which can provide for me the likely relationship between the wind at the airport and the wind on site. This differentiates corners of buildings, centre of the site and a couple of other positions. I am struggling to understand how I could apply different wind speed ratios to different parts of the site grid.
For first year, it seems to me, just applying a single multiplier for different parts of the grid will be sufficient. But, the broader question of comfort with wind direction across the city seems worth pursuing for later exercises.
I would welcome suggestions. Hopefully, the attached script works. I have tried to bake the Rhino data into the script, but I cannot bake the Geometry pipeline.
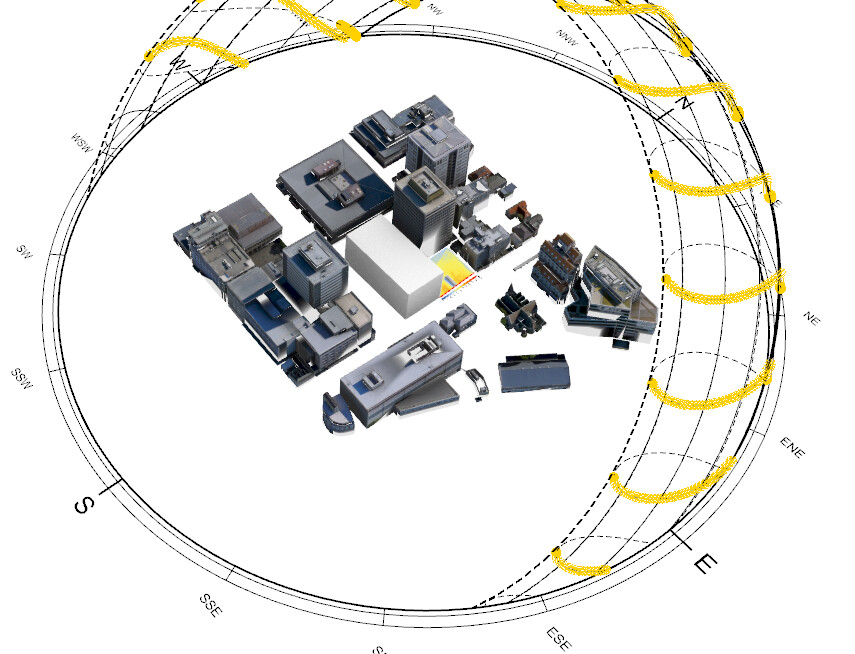
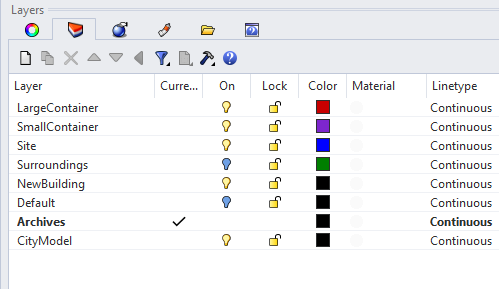
Essentially, there are 5 geometry pipelines:
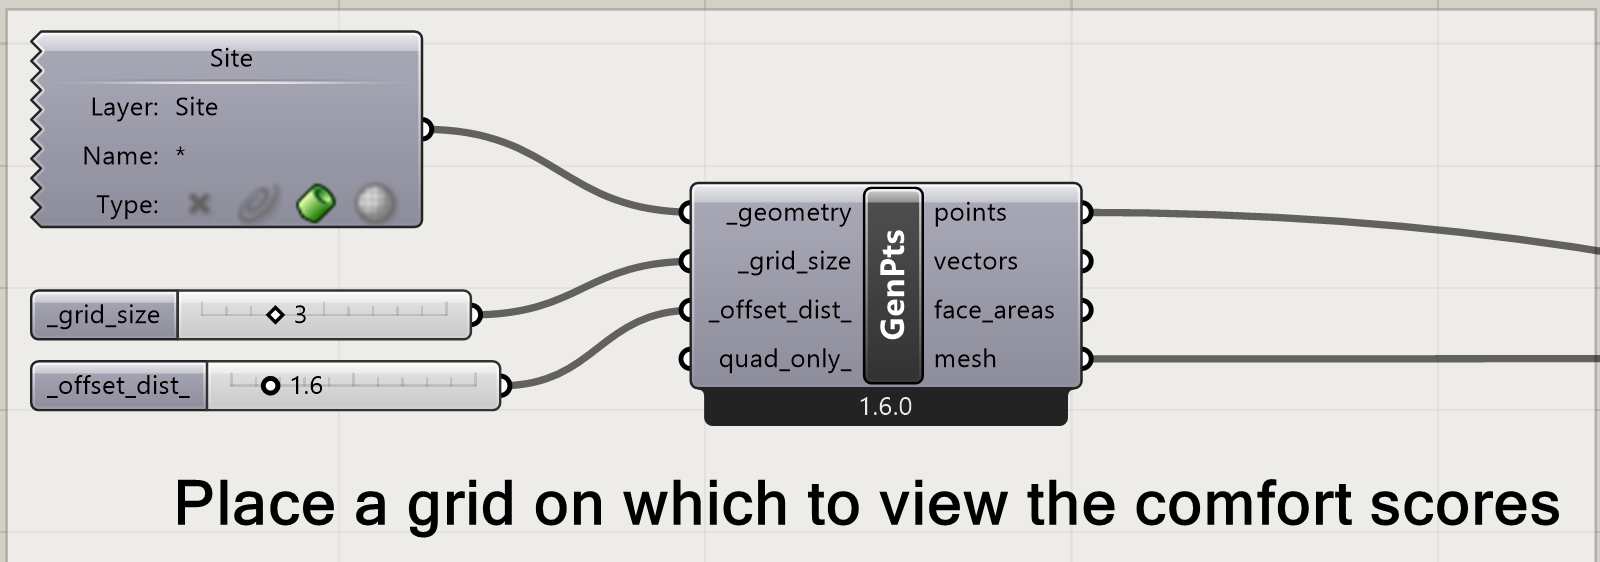
Layer “Site” - the plane onto which the comfort grid is imposed
And 4 Layers representing ‘context’
Layer “Surroundings” - the simple shading objects representing the local surroundings
Layer “NewBuilding” - a neighbouring building under construction
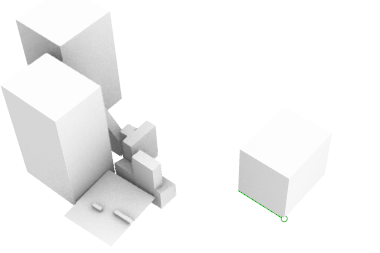
Layer “Large Container” - a shipping container geometry for the main coffee making activities of the on-site cafe that is the students’ design focus
Layer “Small Container” - a half container for cafe storage.
This one is for @chris to answer. I can be wrong but I believe we have a way to read CSV data for outdoor comfort. Here is a related discussion on the Pollination forum:
Thanks, @mostapha . And, yes that is essentially what I would recommend for @MichaelDonn 's case here. I have not yet gotten the time to put together a PET comfort map recipe but I eventually plan to have one and I would make sure that it can accept a folder of CSV files with air speeds just like the UTCI mapping recipe does so that you can incorporate wind patterns you get from CFD or a wind tunnel.
In the meantime, you will see on that Pollination post that you can basically post-process the results of the comfort mapping recipes to add your custom air speeds. You’d basically just replace the “LB Adaptive Comfort” component in the sample .gh file over there with the “LB PET Comfort” component.
Thanks for this. I am still working on understanding the csv file. But, Think this should work:
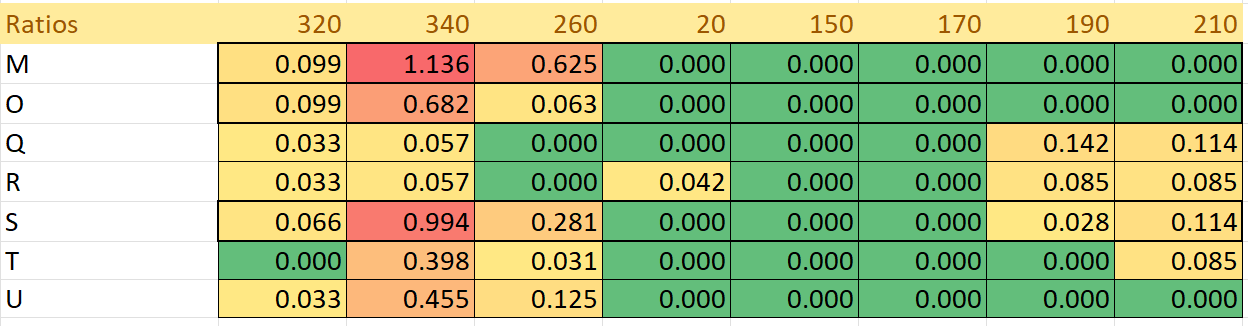
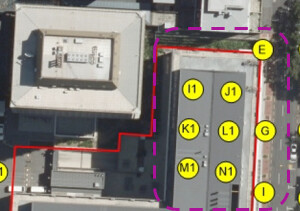
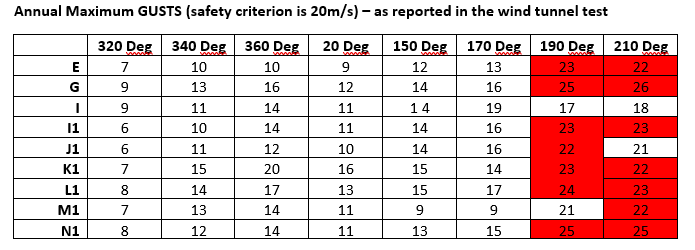
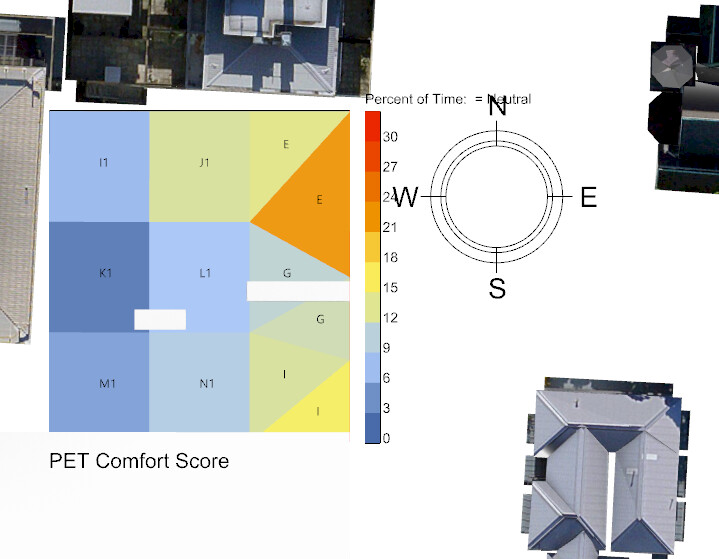
I have this table of ratios relating the wind speed to location:
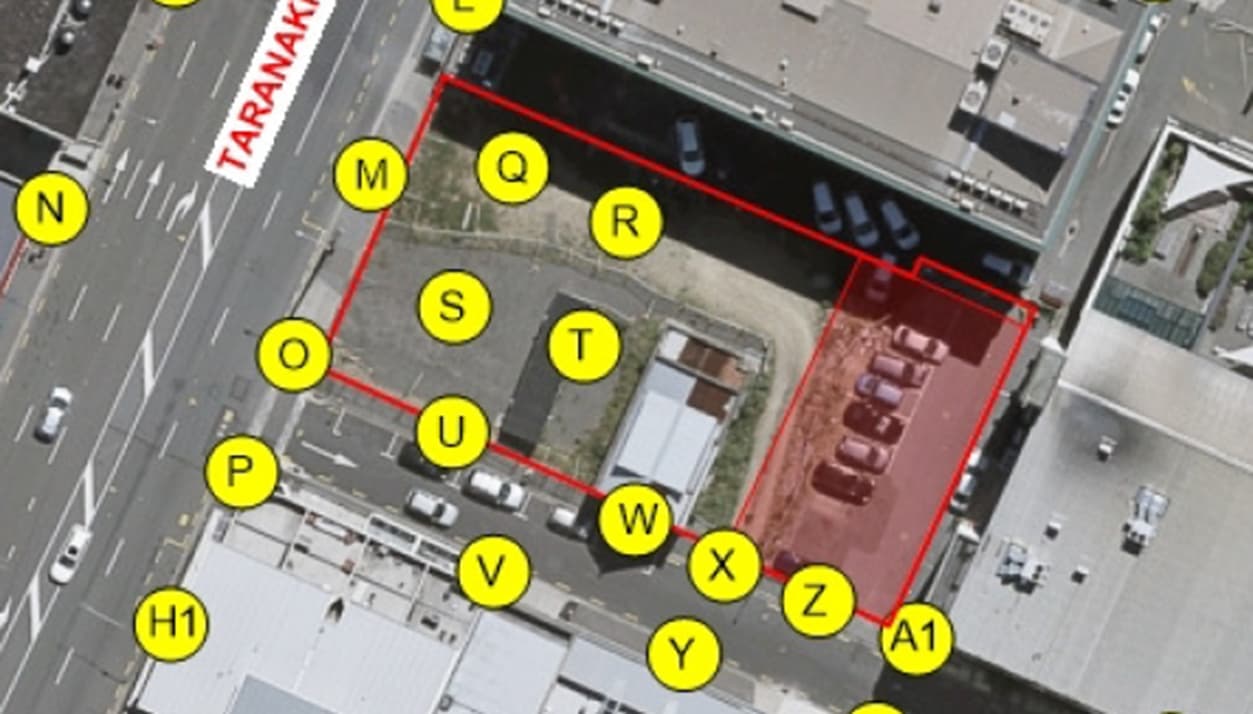
As I understand it, when I have multiplied the airport wind speeds by each location’s (point Identified by a letter in the picture below) of directional ratios, I need to create a csv file with a column for each location of a set of converted 8760 wind speeds?
The one thing to note is that you should also be creating a SensorGrid with one sensor point at each of those locations so that you can calculate PET at each of those places. And, until I add a PET mapping recipe with support for the CSV input, you should just load that data of the CSV file directly into Grasshopper and use it with the LB PET Comfort component, similar to the Pollination post that Mostapha linked to.
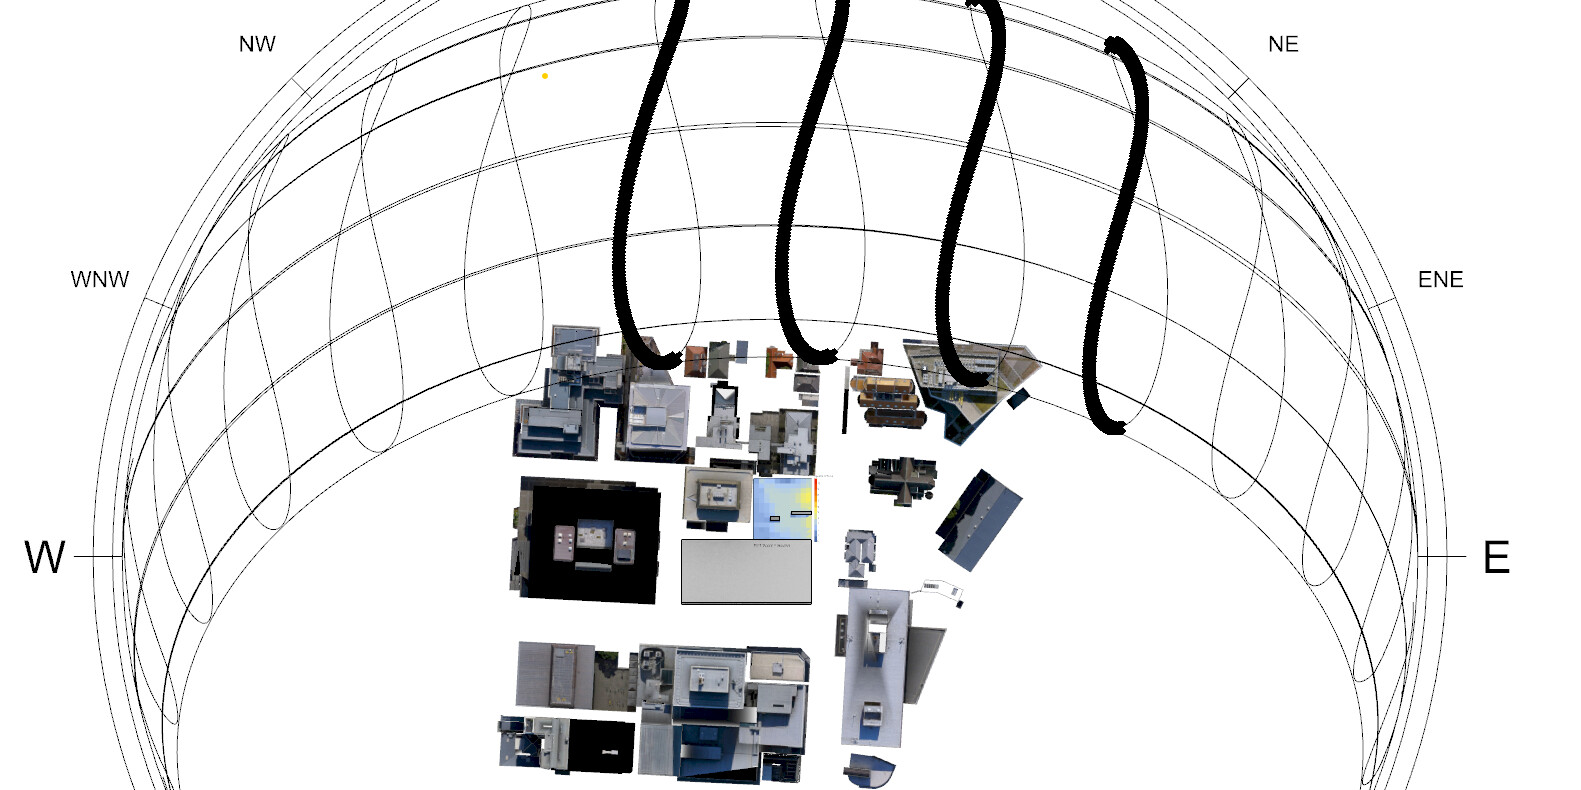
This then generates the Heat Map shown above. Factoring in position based wind speeds was next. I can certainly alter the wind speeds by a single factor very easily to account for the difference between the Airport 10m above the ground data and the average on-site wind tunnel measurements, but multiplying this by each point’s wind direction factor seems to be where I am having conceptual issues. As I read your csv file format / or rather the baked in data in the example, you have wind speed factors for every 10 degree sector of the compass (0 to 35):
I see that you’re just using the Ladybug components and you aren’t actually running a recipe here. In that case, a lot of what I said above is not really relevant.
But, yes, you need to find a way to coordinate the points where you have done wind tunnel measurements with the points you are plugging in for your “PET Map”. I was under the impression that you were only trying to evaluate the PET at the points where you had taken wind tunnel measurements. If you are trying to make more of a continuous map, then you need to develop some way to interpolate between your wind tunnel measurements so that you can provide wind speed values for each of the PET map points. Maybe it’s better to start off with only calculating PET for your wind tunnel measurements and you can try to make a smoother map later.
What you basically want to plug into the “LB PET Comfort” component is a list of Air Speed DataCollections, with one collection for each of your sensor points. This can give you something that aligns with the hourly MRT values that you are currently plugging into the “PET Comfort” component. You can build these data collections using the components under 1 :: Analyze Data. And you can use your wind factors along with the EPW wind speed and direction to determine the hourly wind speed at each sensor point.
Thanks for taking the time to address this @chris .
The AirSpeed data collection requires me, I think, to export all 8760 Wind Speed and Direction lines of data in the weather file, to set up a formula that applies a different multiplier to the wind speed for the appropriate for that hour wind direction for each point, and to export these wind speeds, for each location column as a csv file. This is too complex for the assignment particularly as it does not seem generally replicable from site to site.
I am going to revert to plotting the sun plus wind plus temperature on a 3m grid with a generic multiplier for the wind speeds, and advise the students to check the extremes of what these wind speed ratios might be to inform their site analyses.
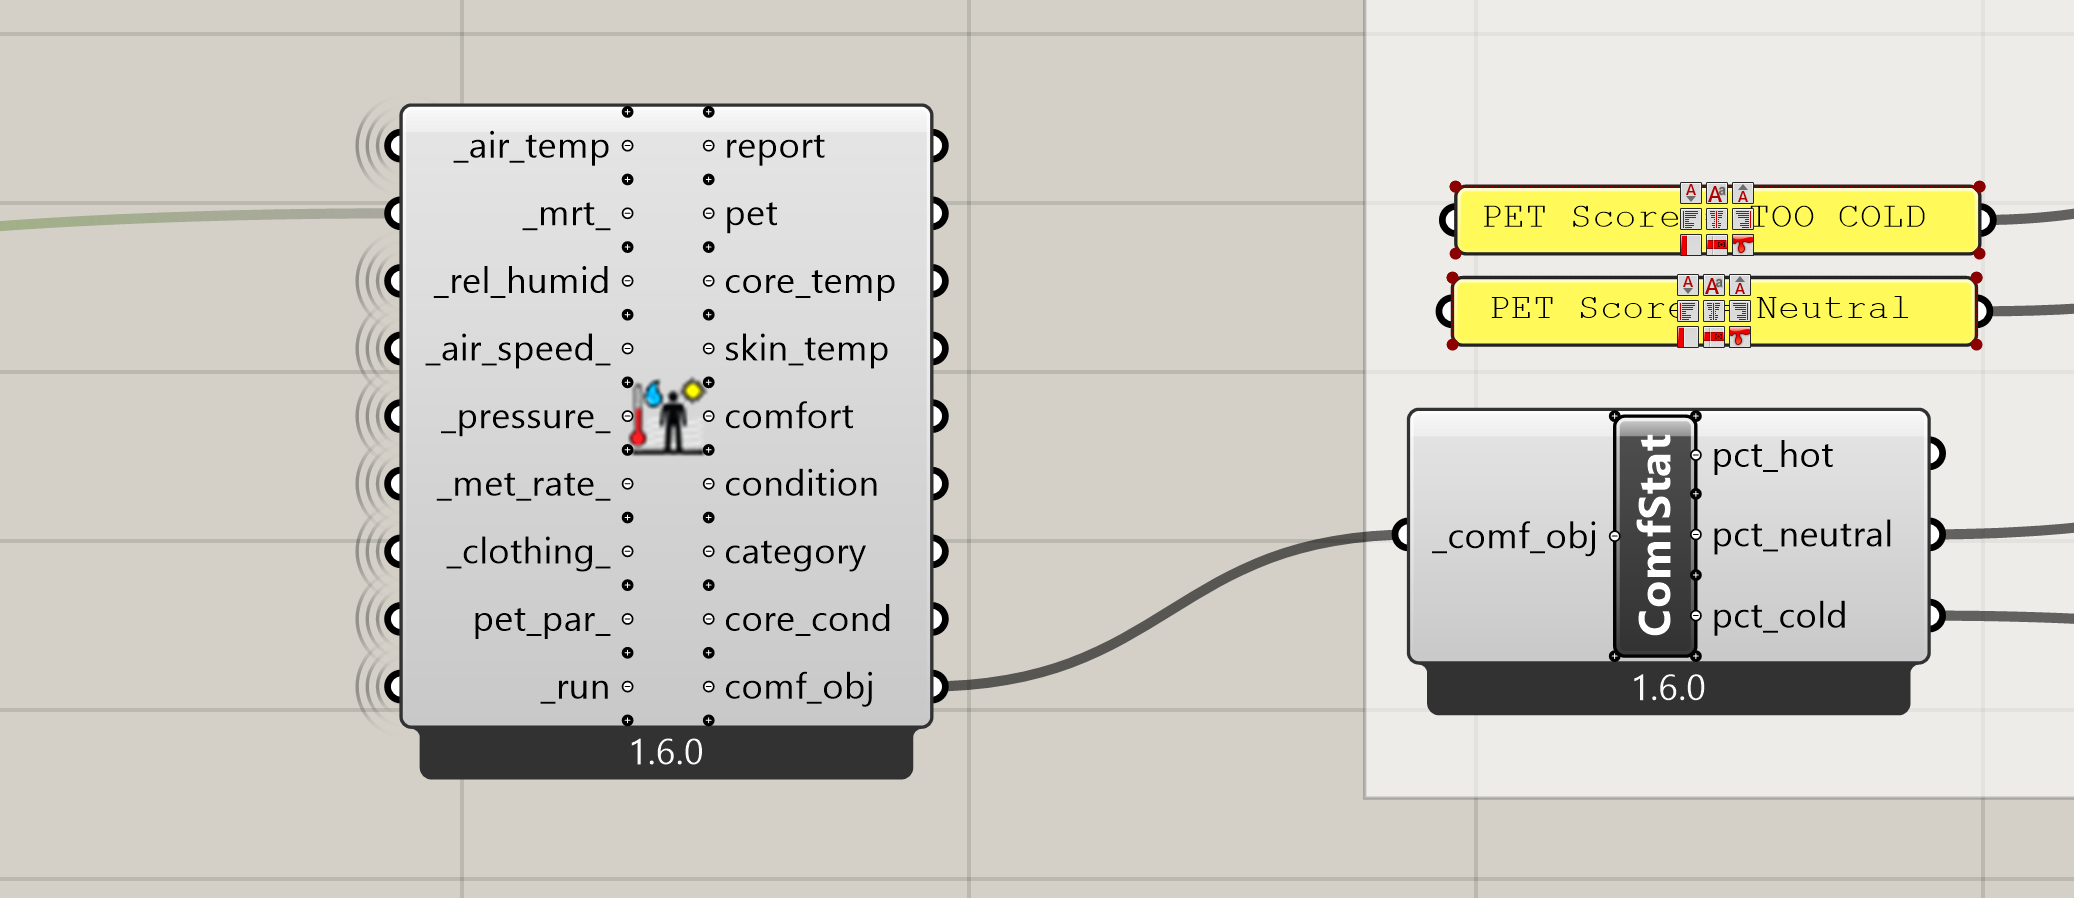
In regards to using a recipe, I started with UTCI basic canyon recipe and added in the PET as it produces a far more interesting / useful / informative output.
With your guidance, the two scripts (Aitken and Frederick PET comfort scores): feed in the ratios between the airport and each location’s wind speed for each relevant direction. Unfortunately, the .3dm city files are too large to upload. And even when I delete all the other city appearance content I am left with a 33Mb file
However, I would appreciate anyone cross checking the logic of the attached gh files.
Any Rhino file with this layer structure should work with these scripts.