Hi all
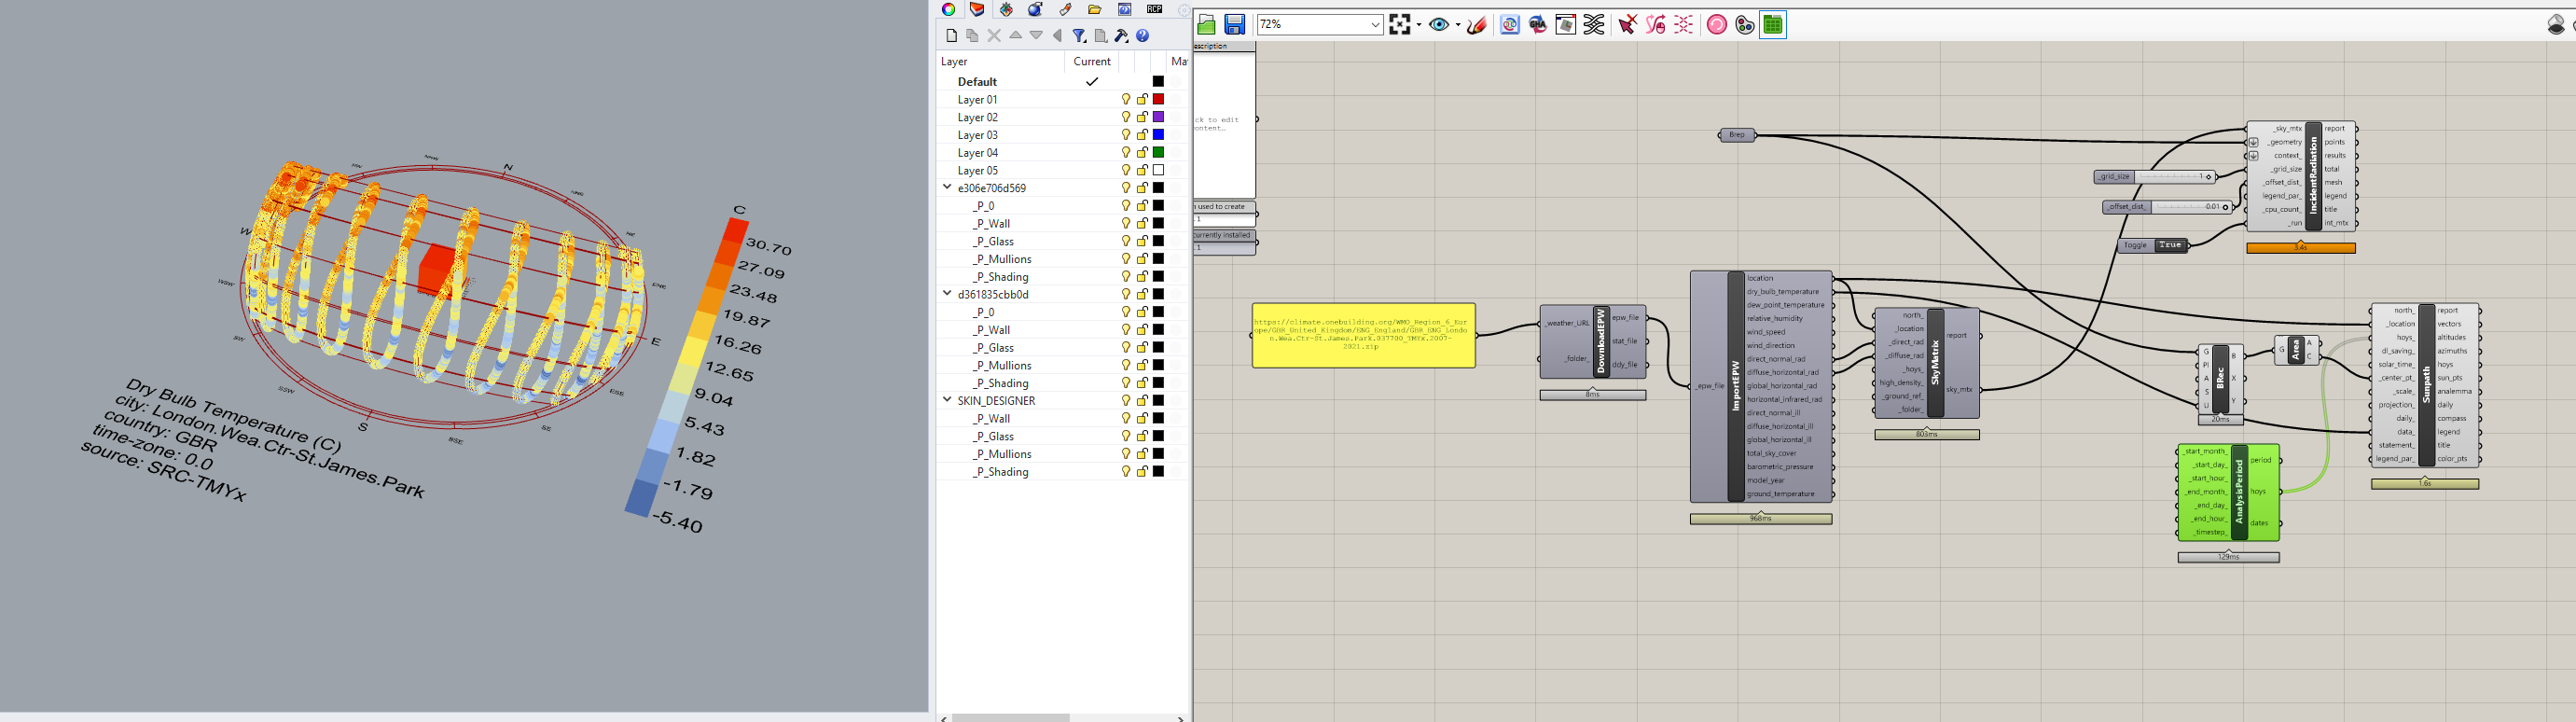
I created a sun path diagram and the legend for it displays the temperature.
My question is what temperature is the legend talking about?
I could only relate it to the ambient temperature. However, if it is the ambient air temperature for a given location of the sun, how is it same for the month of June and Janaury?
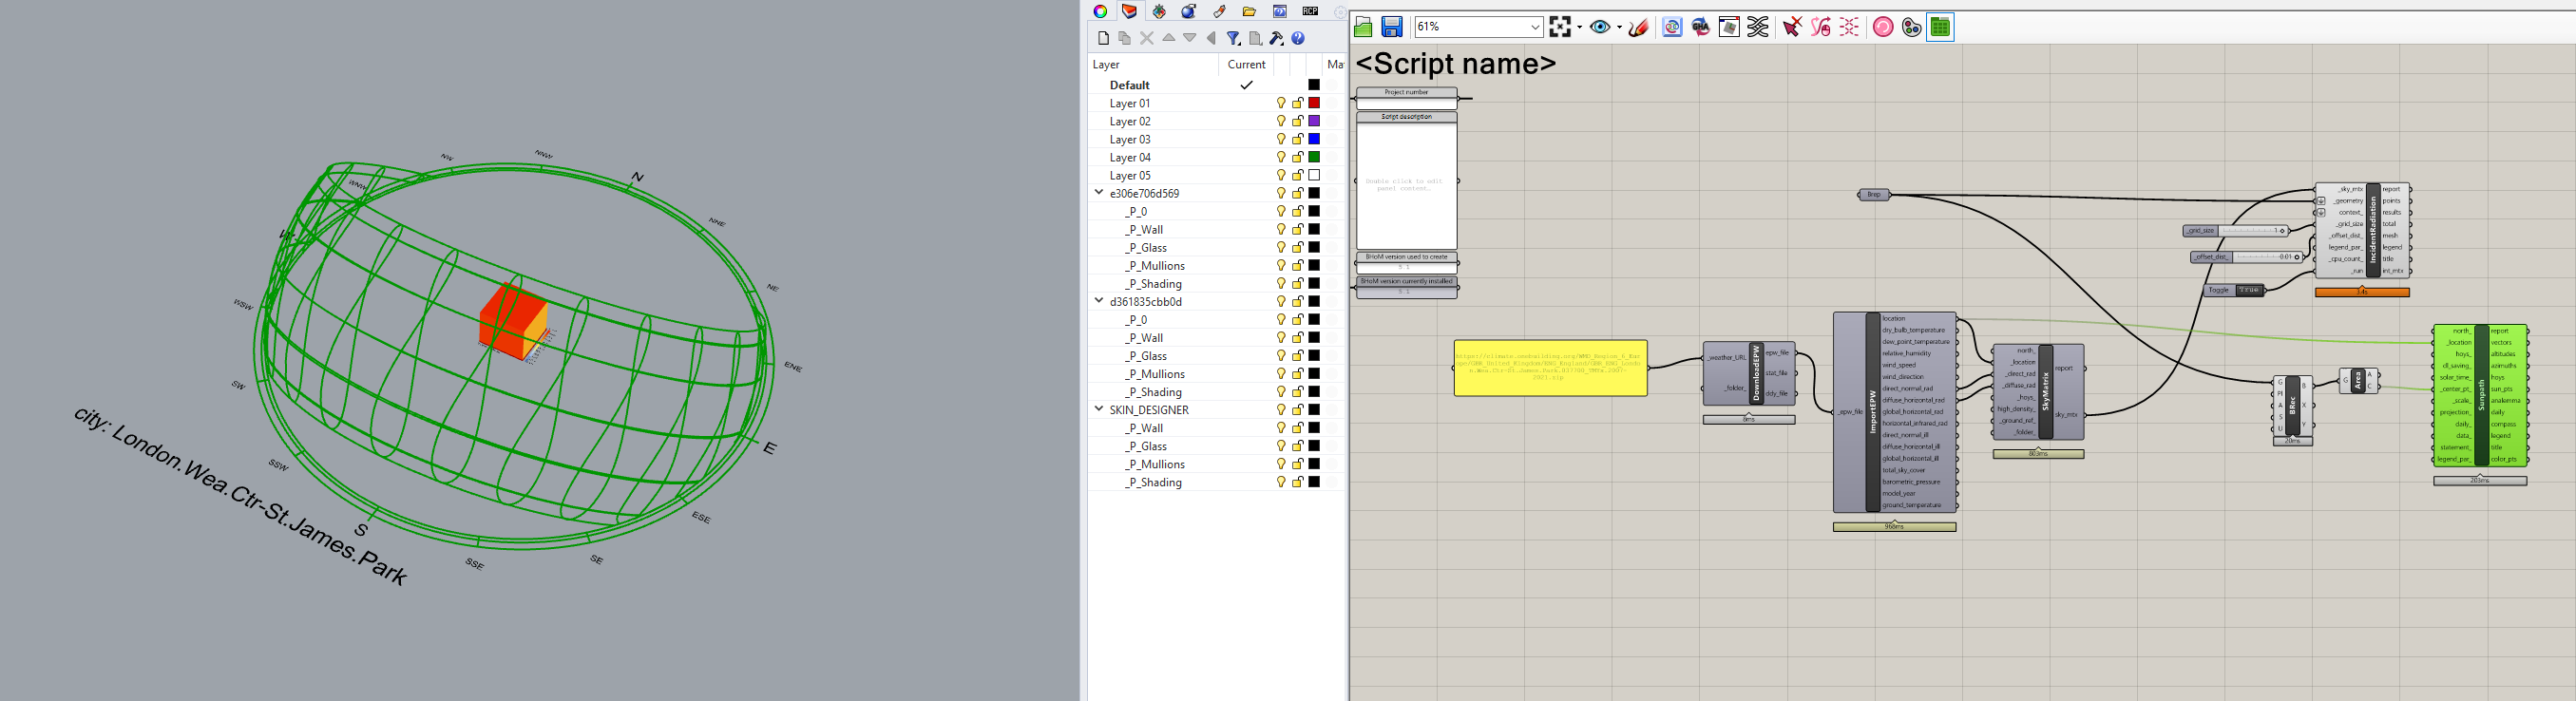
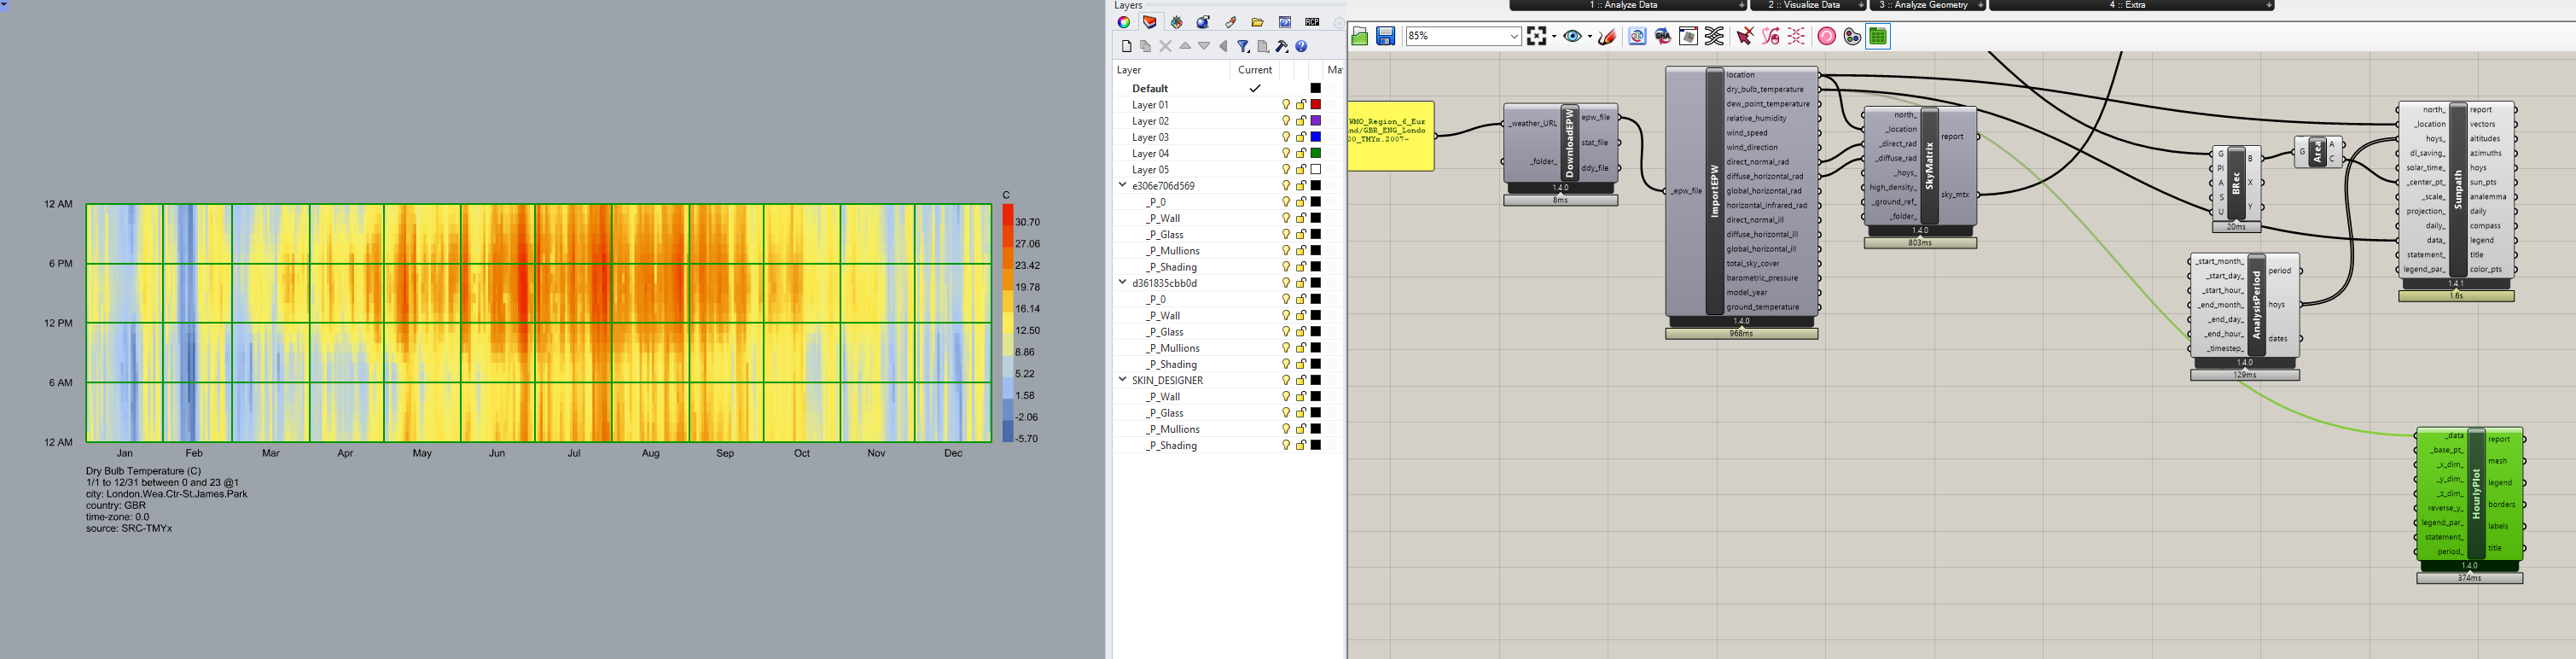
It depends what data you’re visualising, Ladybug can visualise any annual data you send it onto a sun path like that. What does your script look like? The input into the sun path component will show you what’s being visualised.
I created the sun path to understand the sun’s position during different time periods. The default legend showed temperature with colors corresponding to the sun’s color.
I am just curious to know if I have missed something and if the sun path has the ability to give data on ambient temperatures for diff. positions of the sun. If yes, why does it show the same (ambient) temperatures for summer and winter?