Issue with LB Monthly & Hourly chart through 'Python' script and 'Custom Result' component

Hello Everyone,

I am currently facing an issue with LB monthly & Hourly chart generation in Rhino 7 (SR35) using Ladybug tool version 1.8.0, and I am seeking an assistance in resolving this issue.

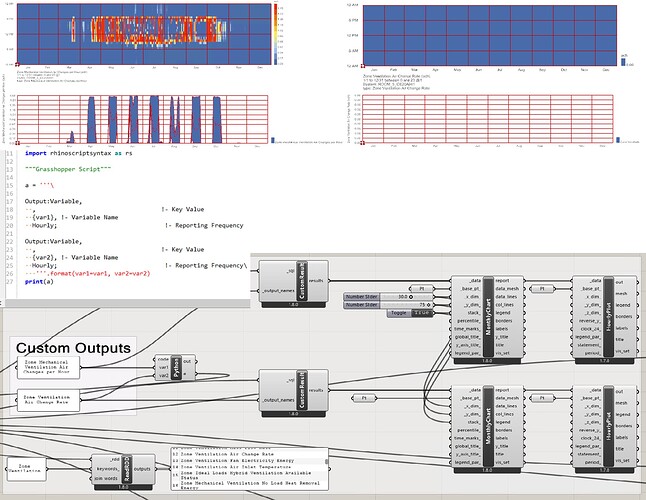
As per the attached screenshot, I am facing an issue where I can only see the charts for ‘Zone mechanical ventilation air change per hour’ input and not for the second input of ’ Zone ventilation air change per hour’. I have also attached python script for python component.

Additionally, I have included a YouTube video which has the major part of the script and covers the topic of my study and the issue I am facing.

Your expertise and guidance in troubleshooting and resolving this issue would be greatly appreciated.

Thank you in advance for your assistance.

You tube Video: https://www.youtube.com/watch?v=GbRYCk70B30

Grasshopper file: https://fastupload.io/en/zNKzrK9Cok3eA4o/file
Thank you for your help. I would try :grinning:

The issue is resolved. I will post the details soon.

I am pleased to inform that the issue I posted on the forum regarding the ‘LB Monthly & Hourly chart not getting generated through custom result component’ is resolved. After checking the script thoroughly and understanding the settings of each component, we were able to pin point the root cause.

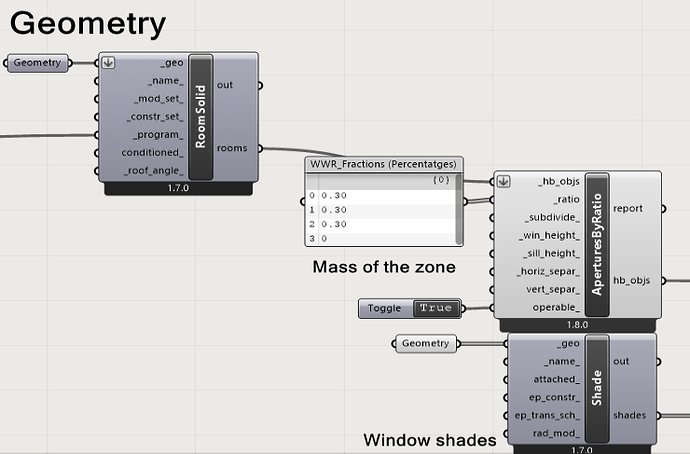
It was established that the issue stemmed from an oversight in the configuration of ‘AperauresByRatio’ component (I have attached the screenshot of the same below). Especially updating the input for windows operability to ‘true’ was crucial to the simulation to recognize that windows are permitted to be open and operable.

By rectifying this setting the charts are finally generated. I want to thank everyone who contributed their insights throughout the troubleshooting process.