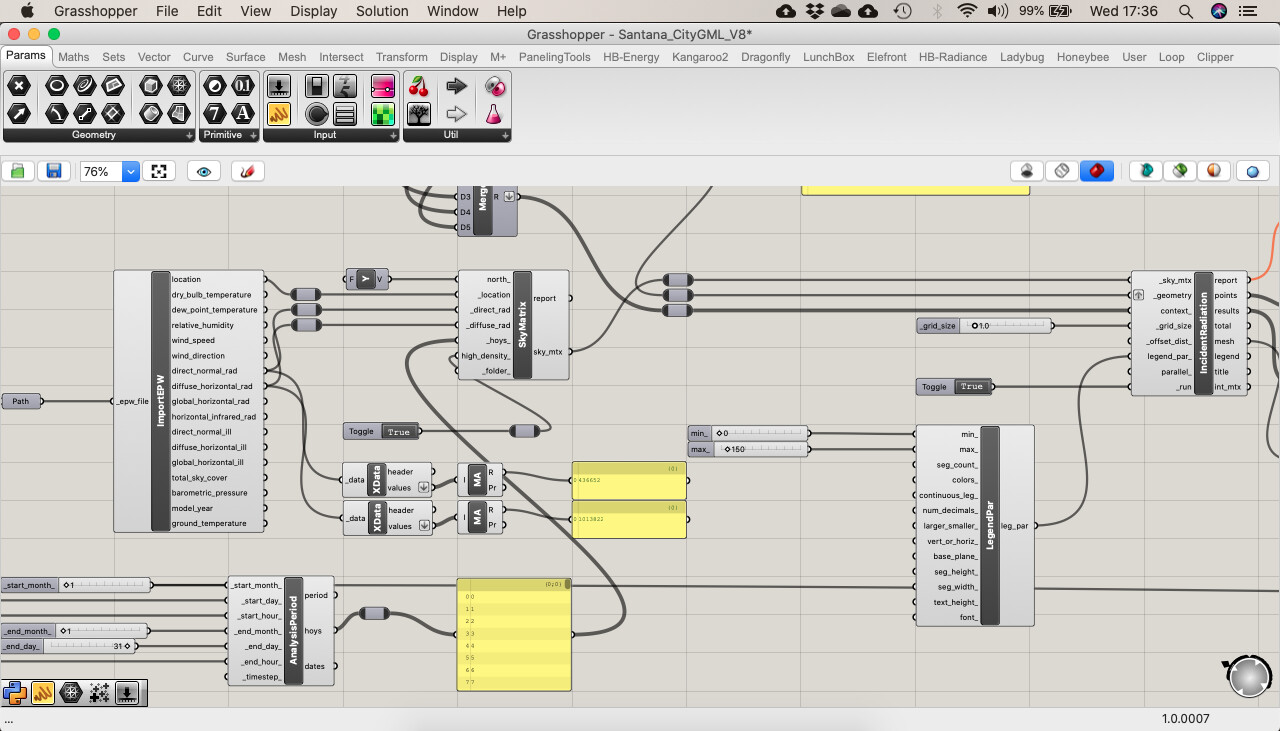
I am performing solar analysis with Ladybug, specifically with IncidentRadiation 1.2.0. This module returns irradiation in kWh/m2 for a specific time interval, which is previously defined by means of the component SkyMatrix 1.2.0. The list of _hoys that is passed into SkyMatrix 1.2.0 is constructed with AnalysisPeriod 1.2.0.
My final goal is to create a list of irradiation values for all hours of the year (HOY, from 0 to 8759) or at least days of the year (DOY, from 1 to 365). Nevertheless, given the way that the ladybug components are designed, I until this moment I cannot pass multiple HOY lists at once in the SkyMatrix component. This means that, for now, I need to manually redefine my AnalysisPeriod for each time interval that is of my interest.
This is possible for 12 months of the year, but definitely not possible neither for 365 days nor 8760 hours within the year. In this sense, I would like to ask you if there is a way to “for loop” in grasshopper with the above-mentioned ladybug tools, so that I can automatically extract this long list of hourly or daily irradiation values.
I send a screenshot of a portion of my workbench for illustrative purposes.
I think that Collibri Itterator as well as Component Name:: LB Real Time Incident Radiation
would be the fastest way to loop through the HOY’s of the rad study.
Tho I’ve never used that component…
(I’m not 1000% sure on how explicitly to use this component: I never have: I’m lazy and would just put 8 CPU’s on the incident rad compo or more in a google compute VM if feeling super impatient ): itter through 8760 via Collibri and append results into an excel or *.csv through a few possible means.
the TT Toolbox that comes with Colibri #thanks@MingboPeng also includes some ‘made for collibri and other shenanigans’ to_excel_ components to help facilitate.
There may verry well be a more elegant and simpler way to do this than the aforementioned ‘brute force’ means that already exists in LBT… BUT: I know that would accomplish the task at least!
And if feeling froggy:
Design Explorer also #Thanks_Mingbo/TT is setup to facilitate super neat PCP plots with visualization for each results: if you happen to have a number of variables at play and want to do a study to cover all the possible combinations.
Further more… (opt/parametric studies are kind of my favorite thing ever…)
if you want to get some EMOO Wallacei is pretty suiting to exporting ‘per solution / itter’ data as well.
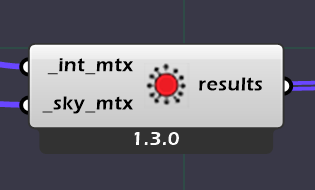
thank you for your explanation! The LB Real Time Incident Radiation works perfectly!
The hint is to first generate one _sky_mtx for each time interval of interest (whether HOY or DOY), and then use the single _int_mtx coming from LB Incident Radiation, which in turn should have been created with a Sky Matrix that consider the whole list of HOYs. The result from LB Real Time Incident Ration will be a data structure with multiple branches, and therefore a dashed line.
Nice!! I’m glad that component solved the issue without having to do any of the ‘Extra Stuff’ , thanks for the gouge on how to use the real time component!
Glad that you found a solution that works for you. If you need irradiance values for every hour, I would also recommend checking out the HB Annual Irradiance recipe, which outputs matrices of radiation at each sun-up hour for each sensor in a sensor grid. You can use the HB Annual Results to Data component to import these irradiance matrices as data collections that can be visualized on hourly plots or analyzed with the Ladybug components.
 ): itter through 8760 via Collibri and append results into an excel or *.csv through a few possible means.