I have many multiple PV panels spread across a site, I want to combine them to view one single AC energy per hour 3D chart.
Is there a way this can be done?
I have many multiple PV panels spread across a site, I want to combine them to view one single AC energy per hour 3D chart.
Is there a way this can be done?
hi @hmurya ,
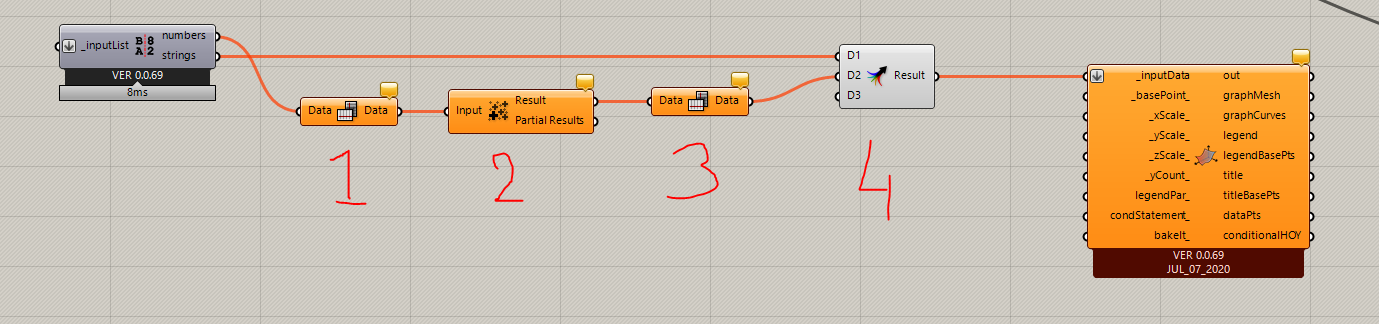
Something like this should work.
Hi Erik,
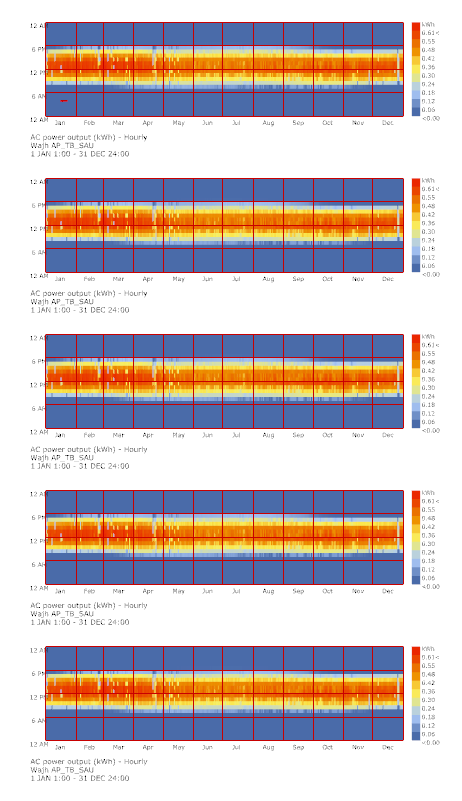
Thank you for your reply. I am looking to combine something shown in the screenshot into one graph. With your example, it adds the hourly data and gives me one single value for each PV panel.
I am looking for an hourly addition across all panels and have 8760 values for all panels added up so i dont end up with 100 graphs, but one graph representing the overall generation.
Hi @hmurya,
I forgot something. The amount of headers is the same as the amount of solar panels.
So you have to filter out the first header.