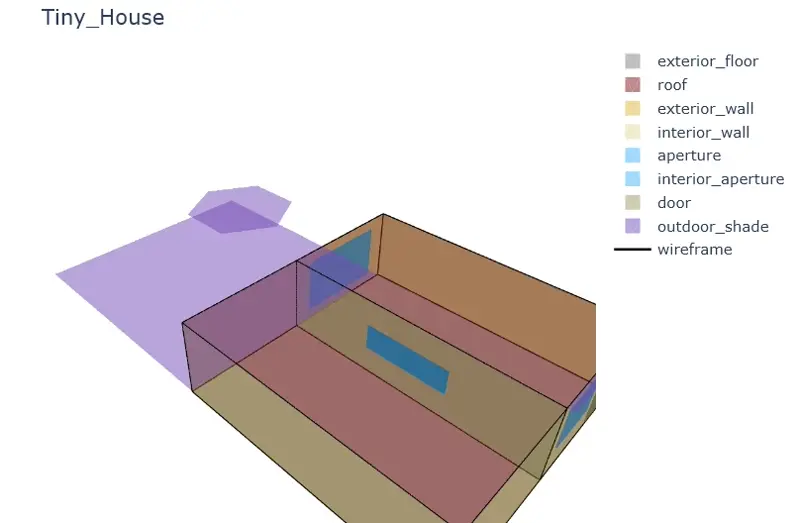
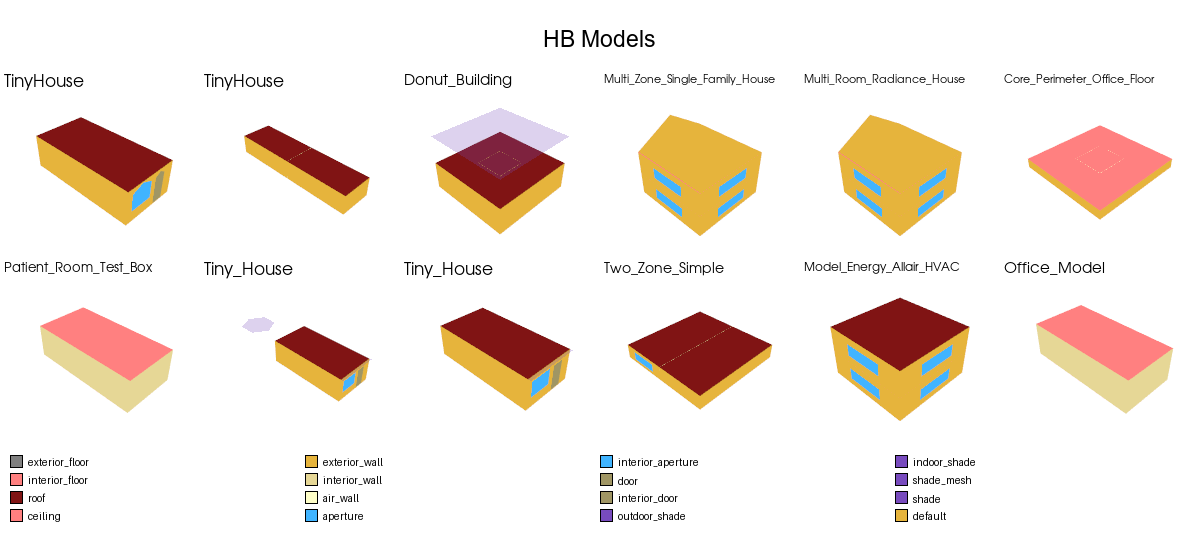
Ladybug tools can be used for really awesome things, also outside of Grasshopper or Revit. I guess I am not the first person experimenting with Honeybee in Jupyter Notebooks. What I was missing for some time was a universal plotting function for the Honeybee models, well-integrated into the interactive Python environment. So I made one. Actually I made two - one to interactively visualize a single model (with Plotly) and another, to compare many models in a grid (with PyVista).
Feel free to use!