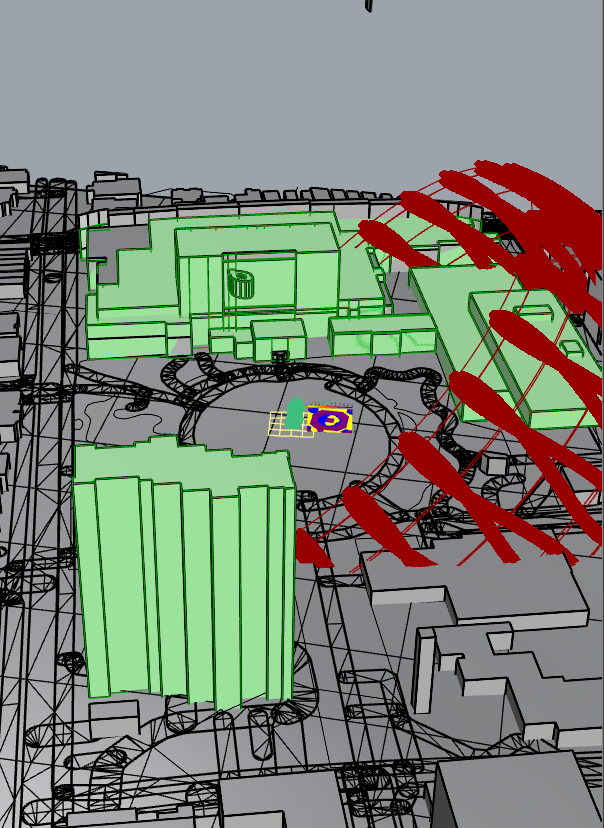
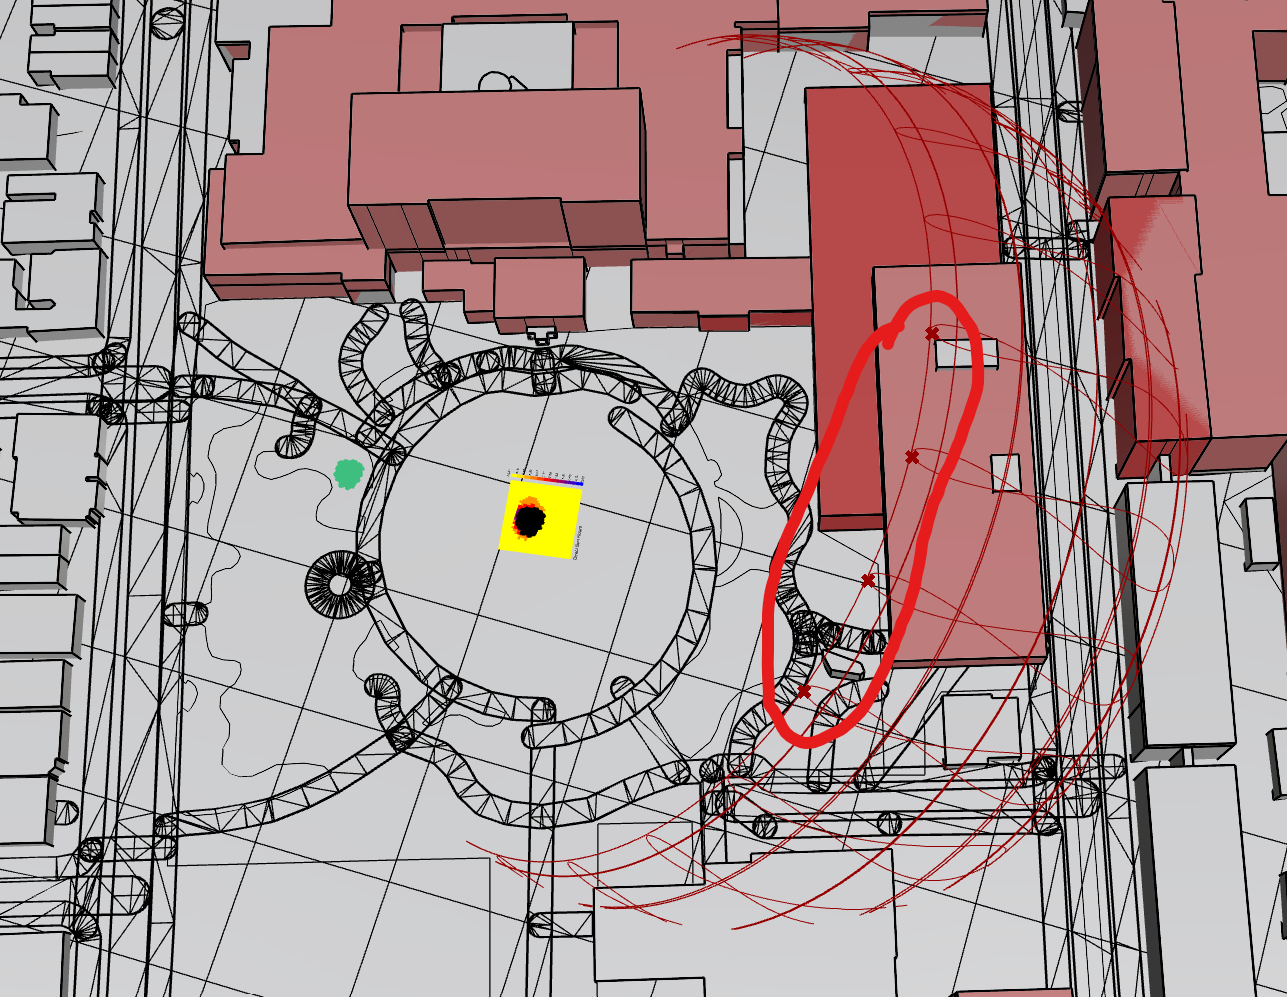
I’m having some trouble with my Ladybug setup for a sunlight hours analysis. No matter where I place my site (a simple square surface), the resulting shadow or low sunlight area always seems to form a circular pattern, which doesn’t make sense for the buildings I selected for context.
I’ve attached some screenshots as well as my Rhino and Grasshopper files for reference. Would really appreciate any insight into what might be causing this!
Without checking your files, I suggest to check the analysis to just a few hours [one single day or less]. Then you’ll get the sense if this is working well or don’t.
A whole year analysis doesn’t makes sense for me, but maybe there is a good reason to do it. Usually you want to check some day in winter/summer or so. If you can explain what your goal is it will be nice to understand and maybe suggest ideas.
-A.
I am trying to design different variations of a public gathering space on the site, which will be used in both summer and winter. This is why I decided to go with the year long analysis instead of just a single day.
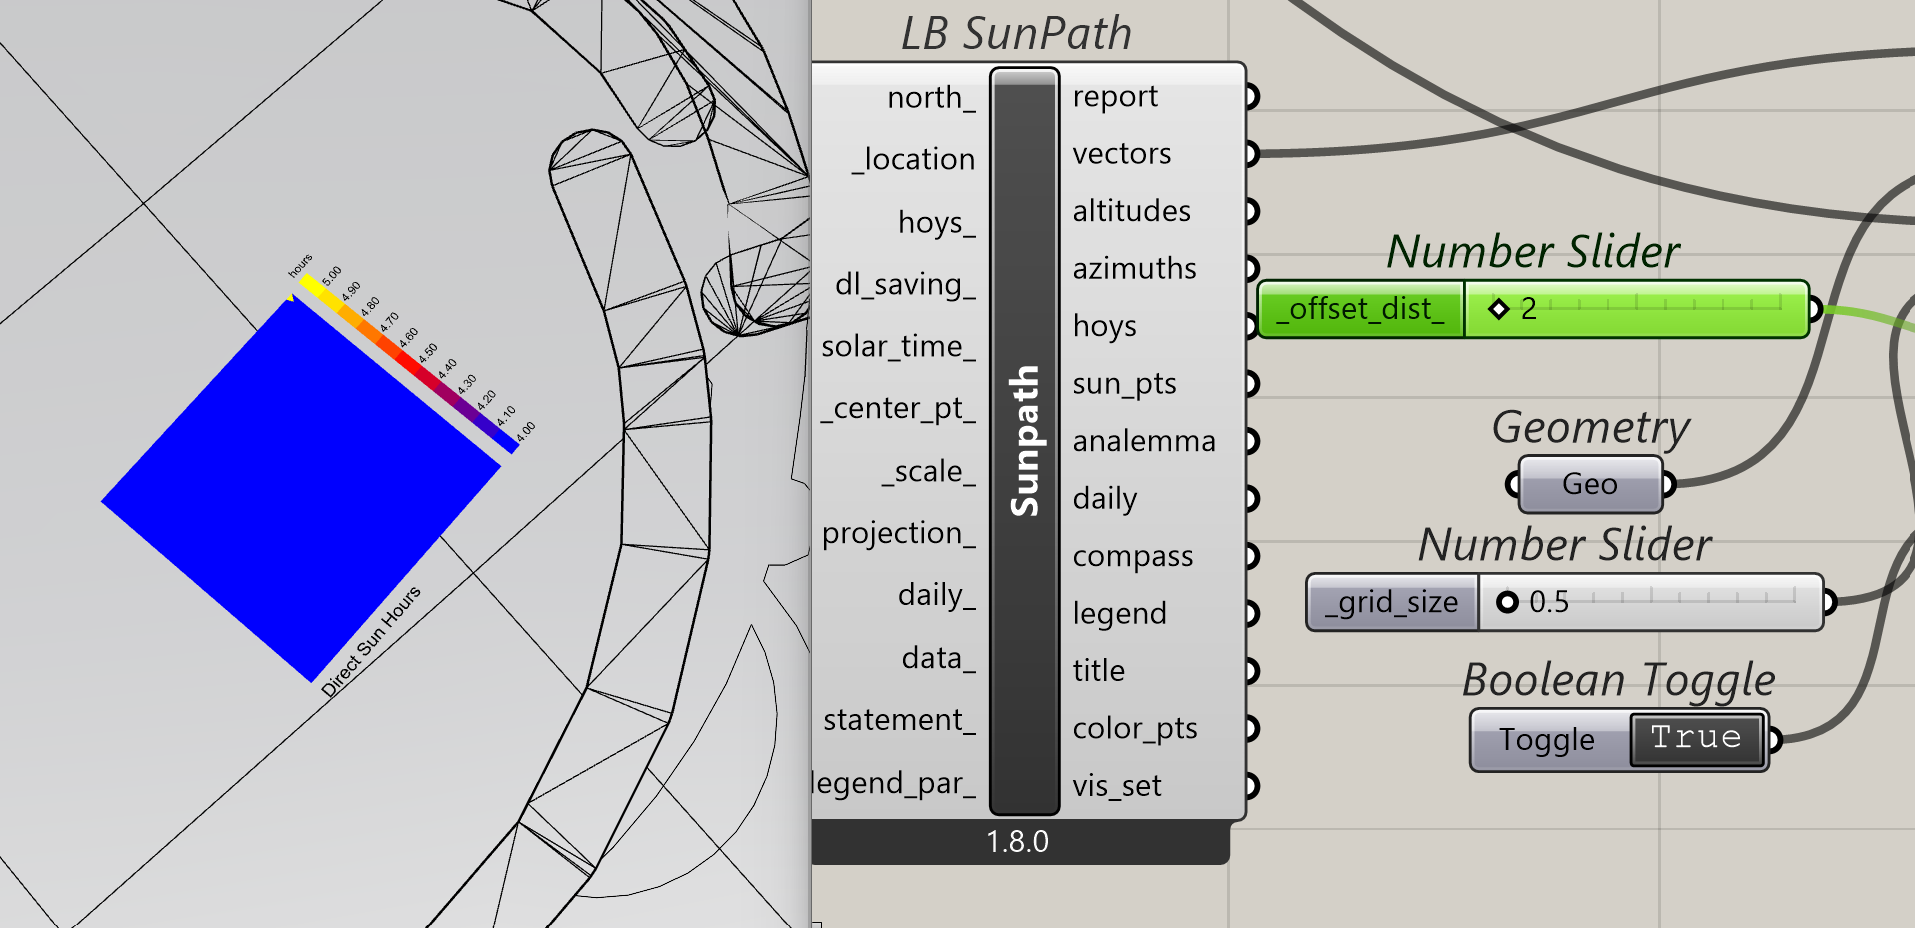
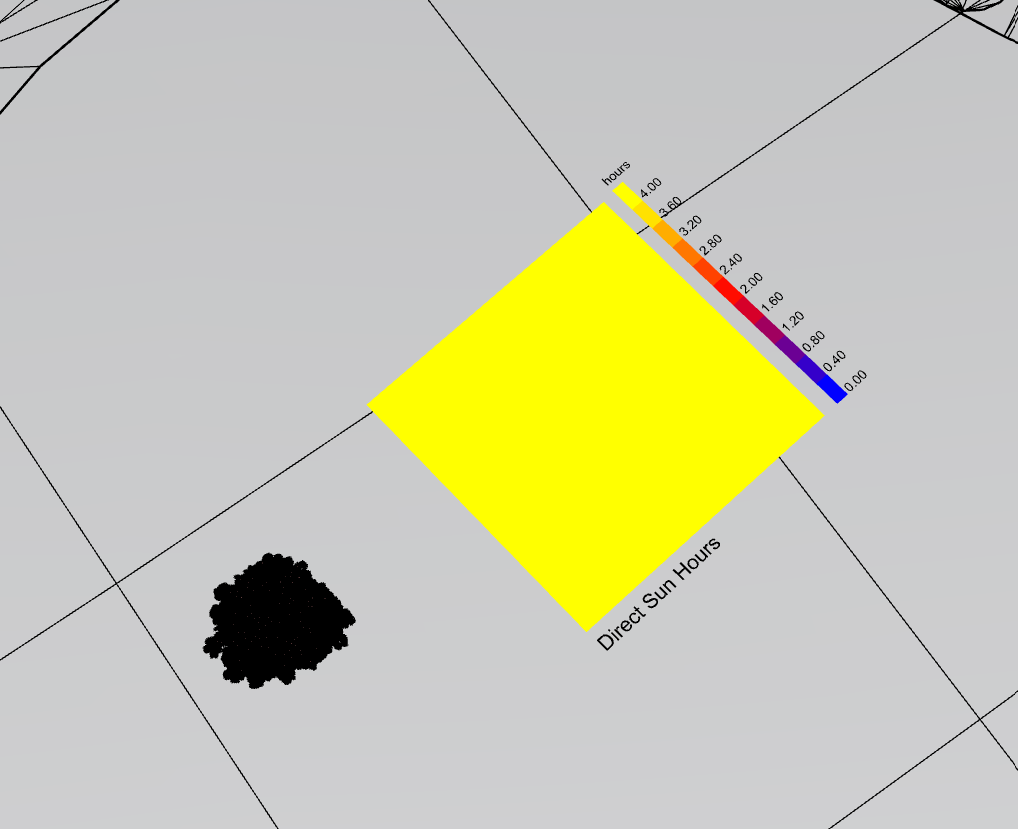
Try to add an _offset_dist_ in the component. The _geometry itself is also included in the analysis, and if there is not offset distance it might cause issues.
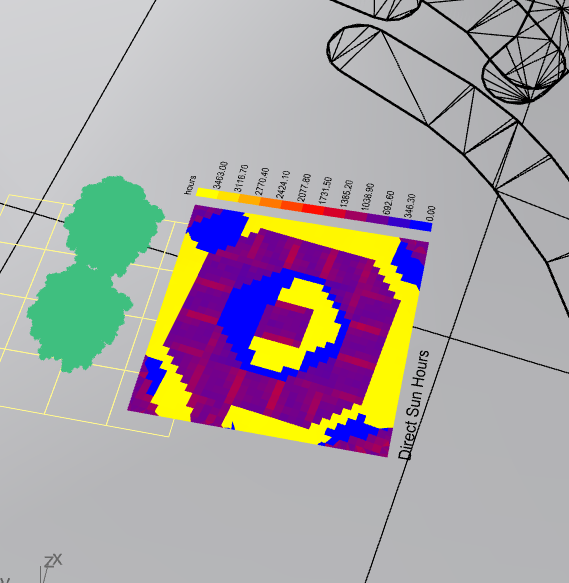
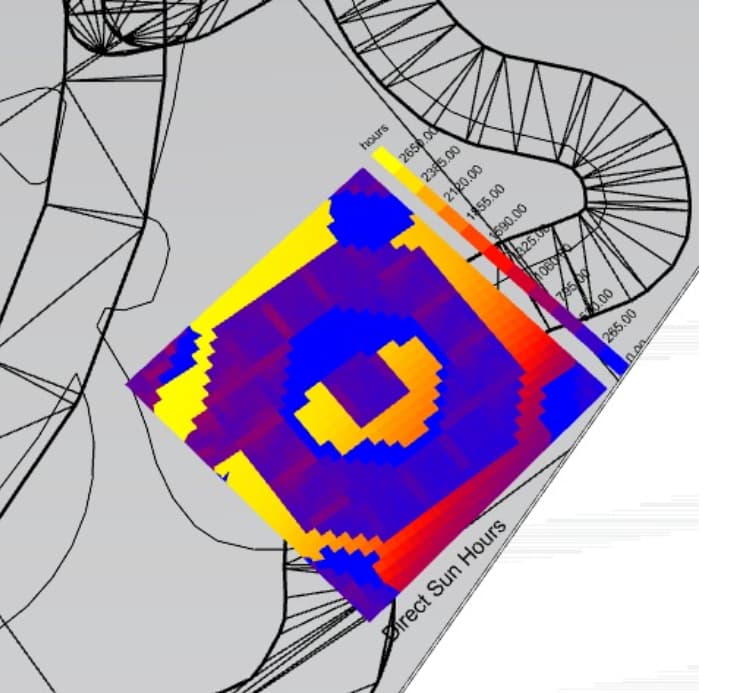
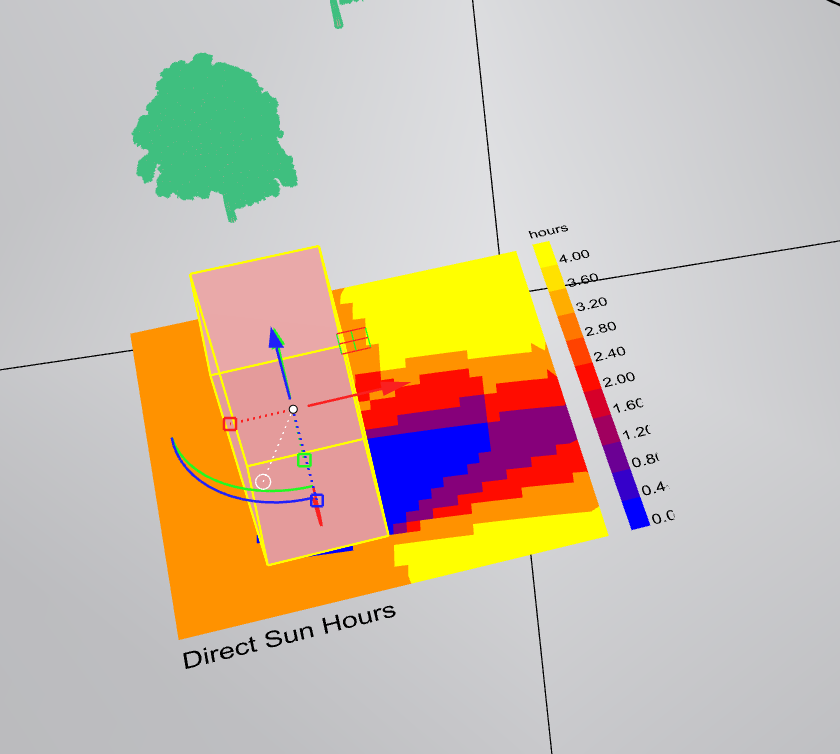
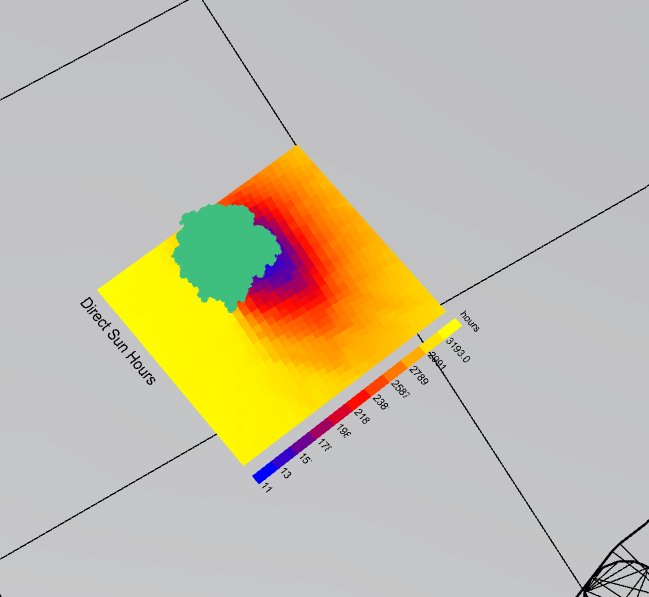
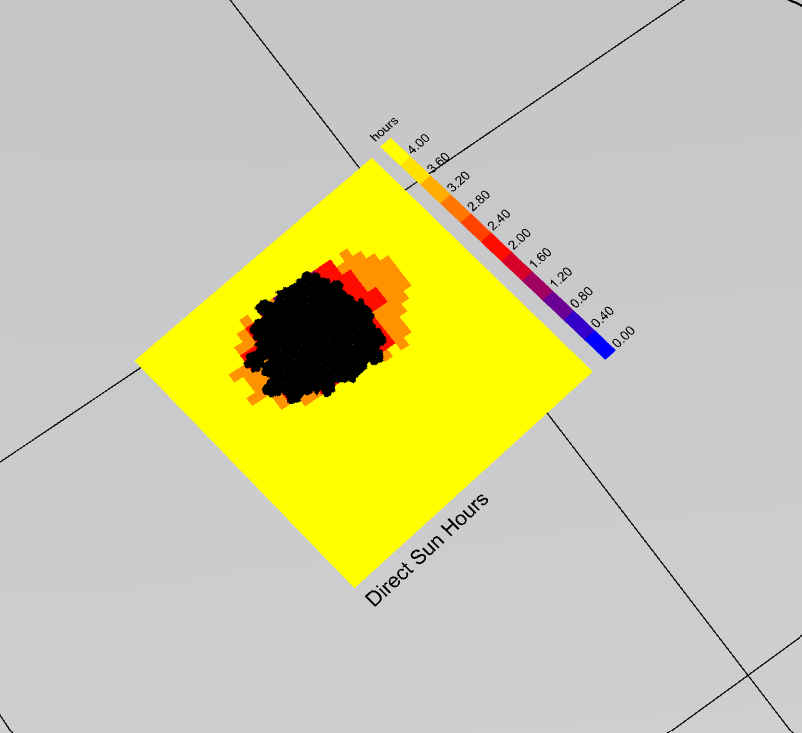
@AbrahamYezioro@mikkel Sorry to reopen this thread again but when I put any objects on the surface, it somehow increase the overall sunlight hours and drastically changes the pattern. I have observed this both when I set the time range to four hours on a specific day or when I select the entire year.
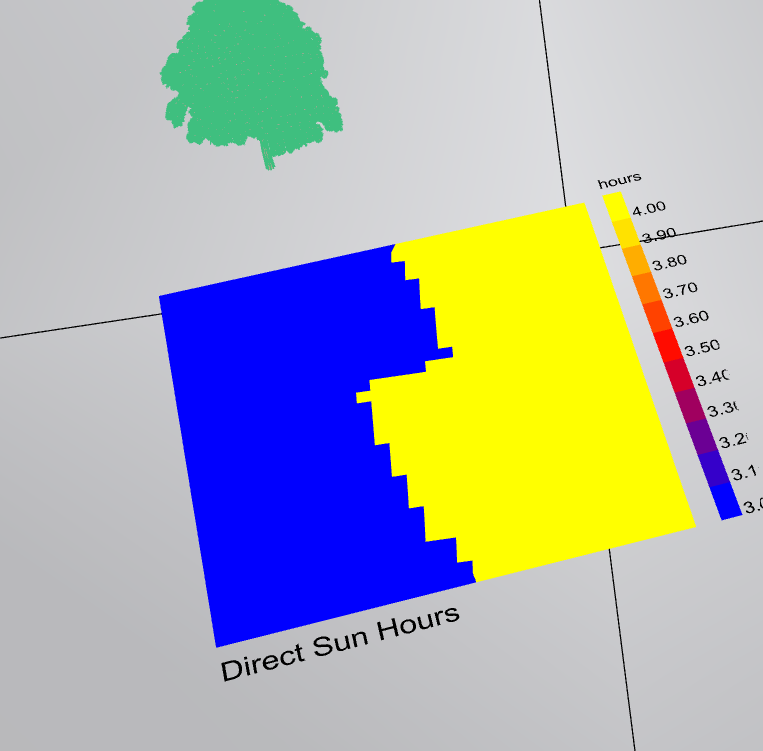
Try setting the legend par scale to the same ranges for both cases. I see from the images that you can not rely only on the colors but also their values [of course]. For instance, the first image goes from 3 to 4 and the second from 0 to 4.
-A.
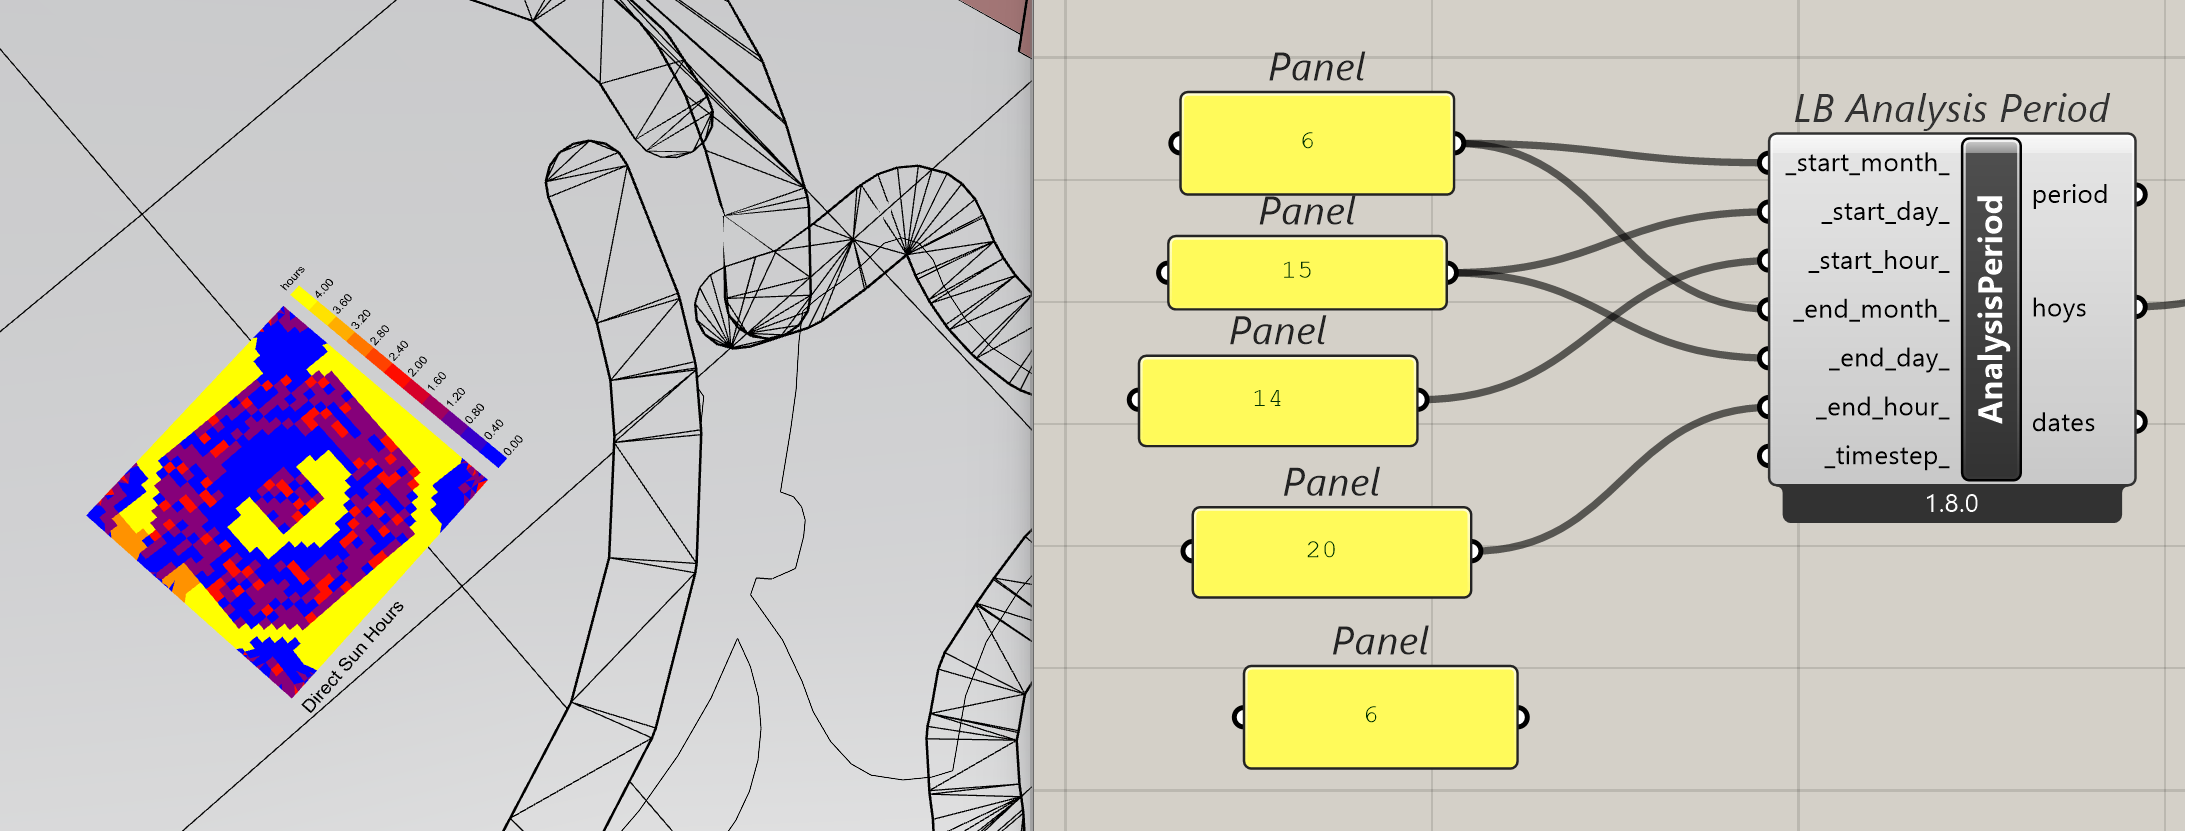
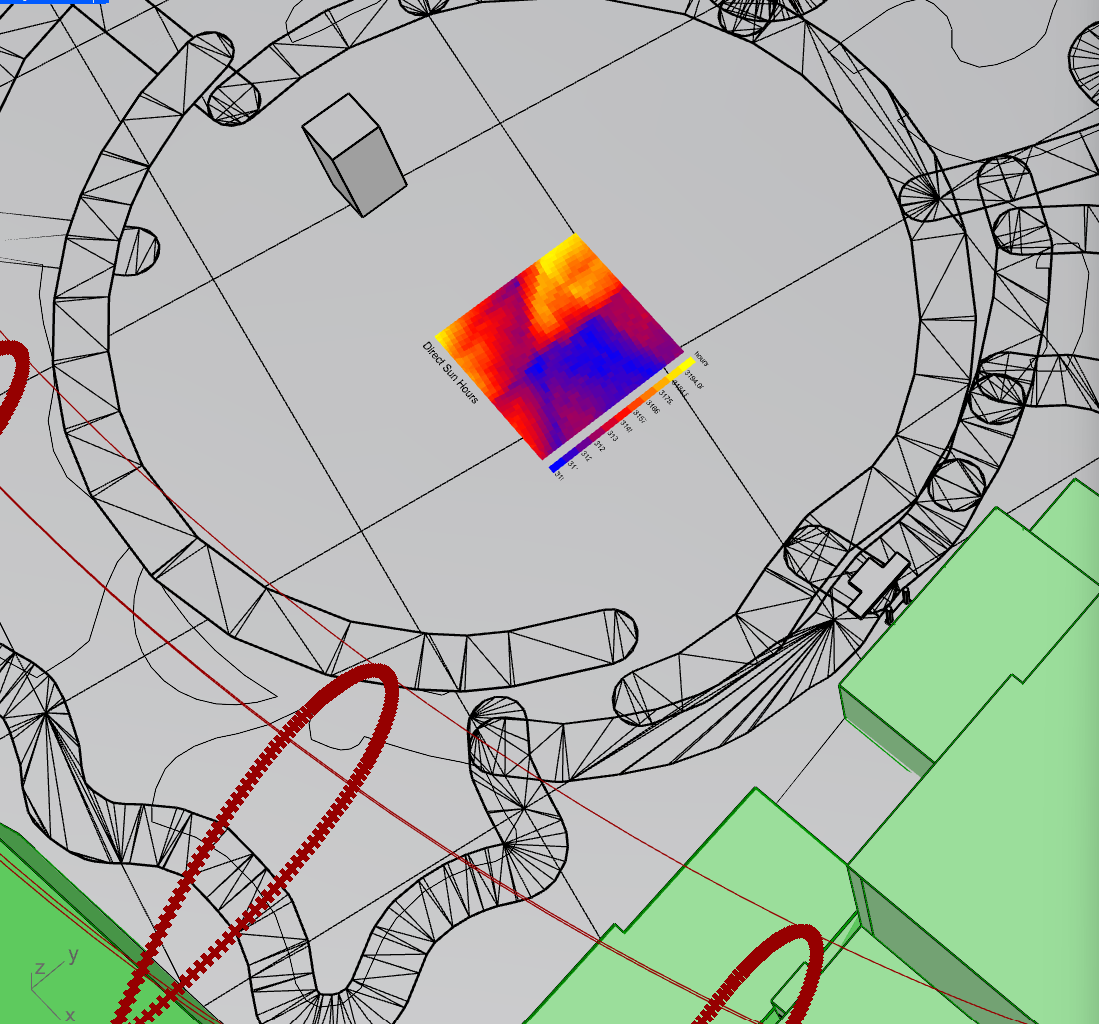
@AbrahamYezioro thanks I think its working now. The only problem might be that the sun path is only showing 4 points throughout the path, as I have highlighed in the picture. Due to that it’s only accounting for the building on the right side. Is there a way to add more points in the sunpath?
Not sure i understand your question.
Do you want more hours? If so, add some in the analysis period component.
Do you want a higher resolution for each hour [i.e. each half an hour]? Add some value into the timestep input of the analysis period component. Check the hint on it.
-A.