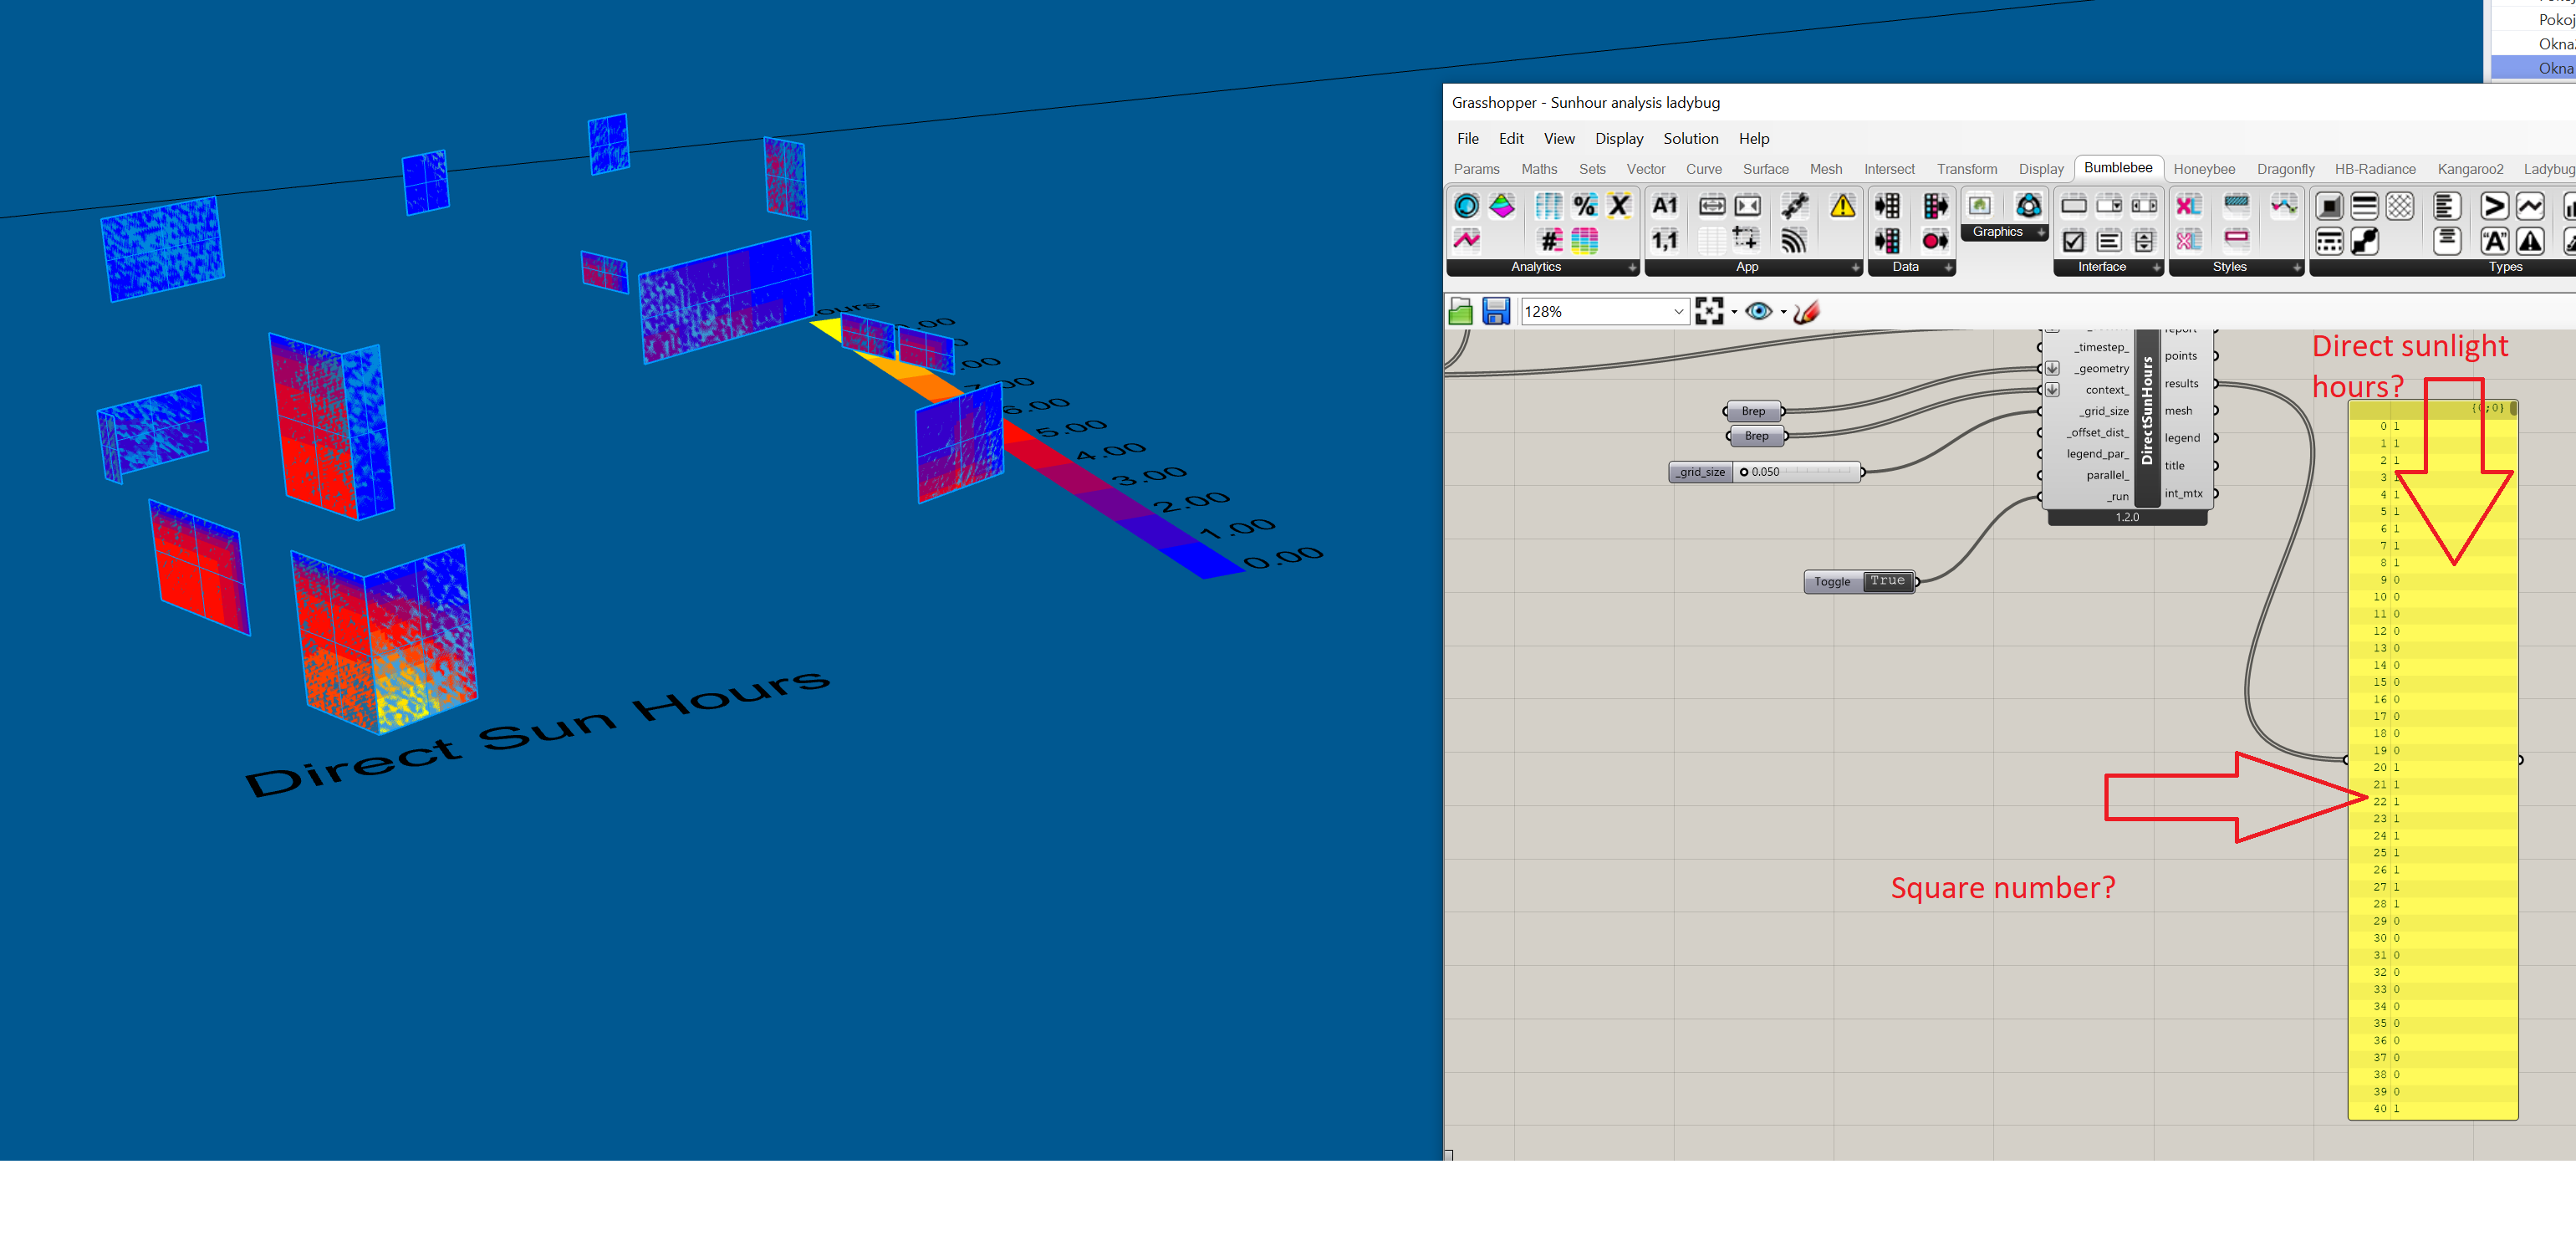
I run sunlight calculations for the windows in the house. Unfortunately, I do not know how to divide the results by window.
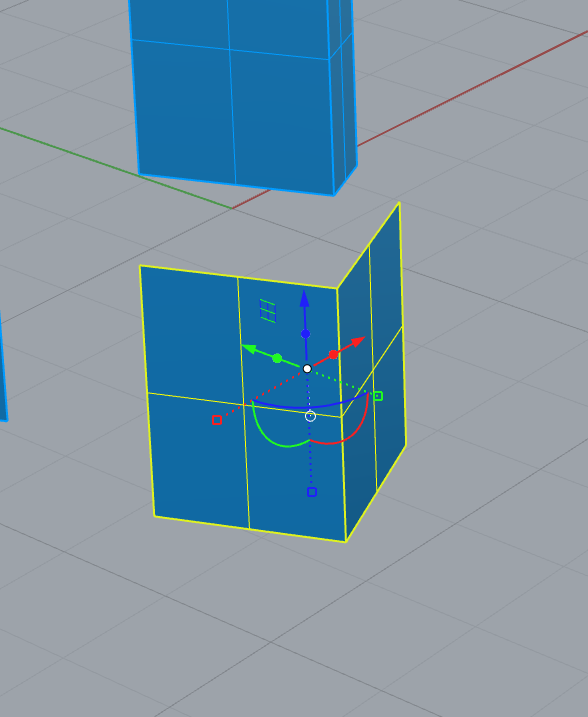
If my understanding is correct. The chosen surfaces were split into little squares (5x5cm in my case) and then, the sunlight hours were calculated for each one of them.
Calculate the sun hours for every window. I believe I can not simply add the values but I have no idea how to do it mathematically. Especially that there are two corner windows so I have to “stitch” data from two surfaces into one to get valuable data for one window.
I would be grateful for the help. My brief imagination tells me that I should somehow mix the “hoys” data with my results and windows geometry but how to do this - is a mystery for me.
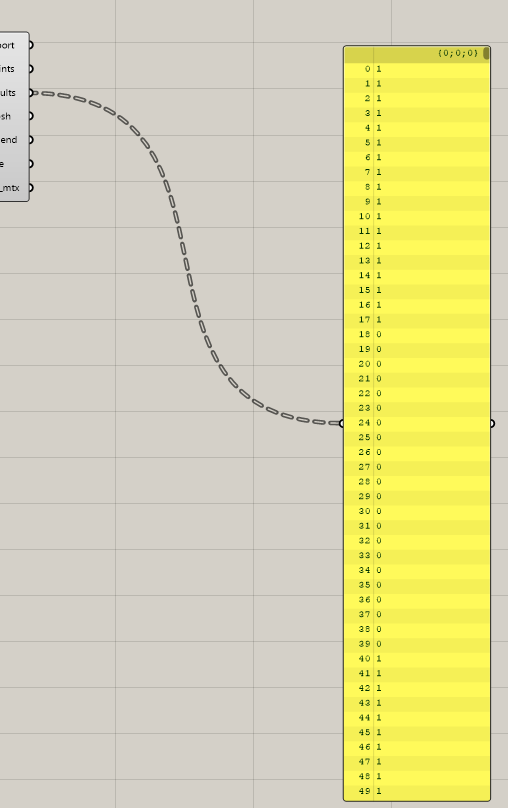
If you don’t have any experience with the DATA TREE STRUCTURE, represented by this dashed string, i strongly recommend to you read about it. Like in this page.
You won’t need too much, but using Simplify and Exploding Tree will help. Cherry picker maybe.
I hope can help about:
You can input your window geometry as one object made by 2 surfaces. Please check the direction of it. Always pointing to outside.
Mathematically, you can calculate a mean result for each list and surface. Or check de minimum and maximum values too.
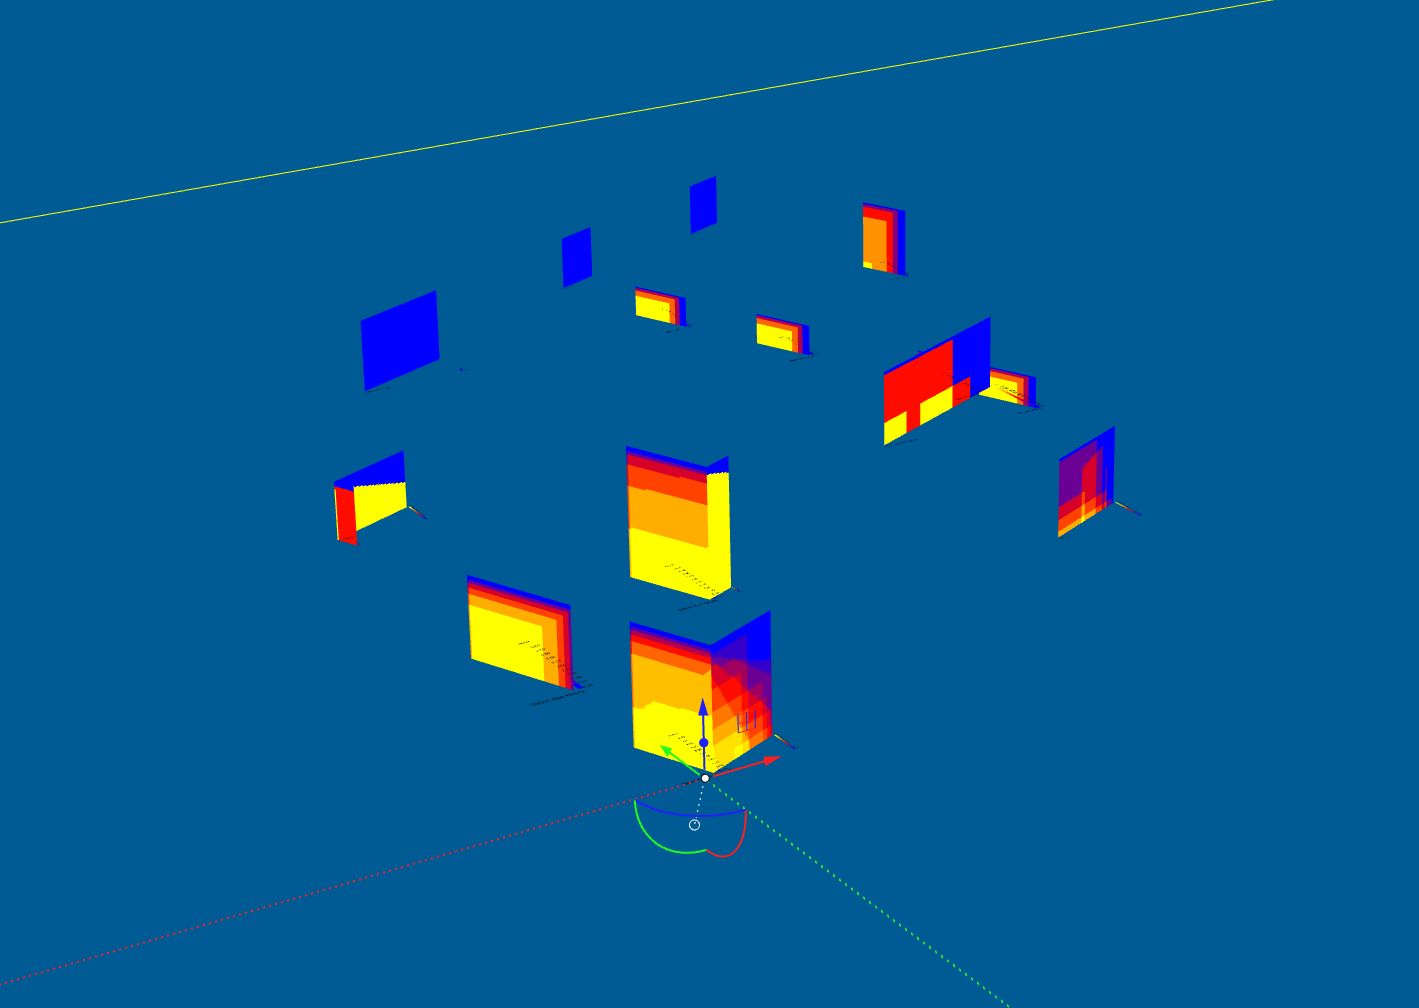
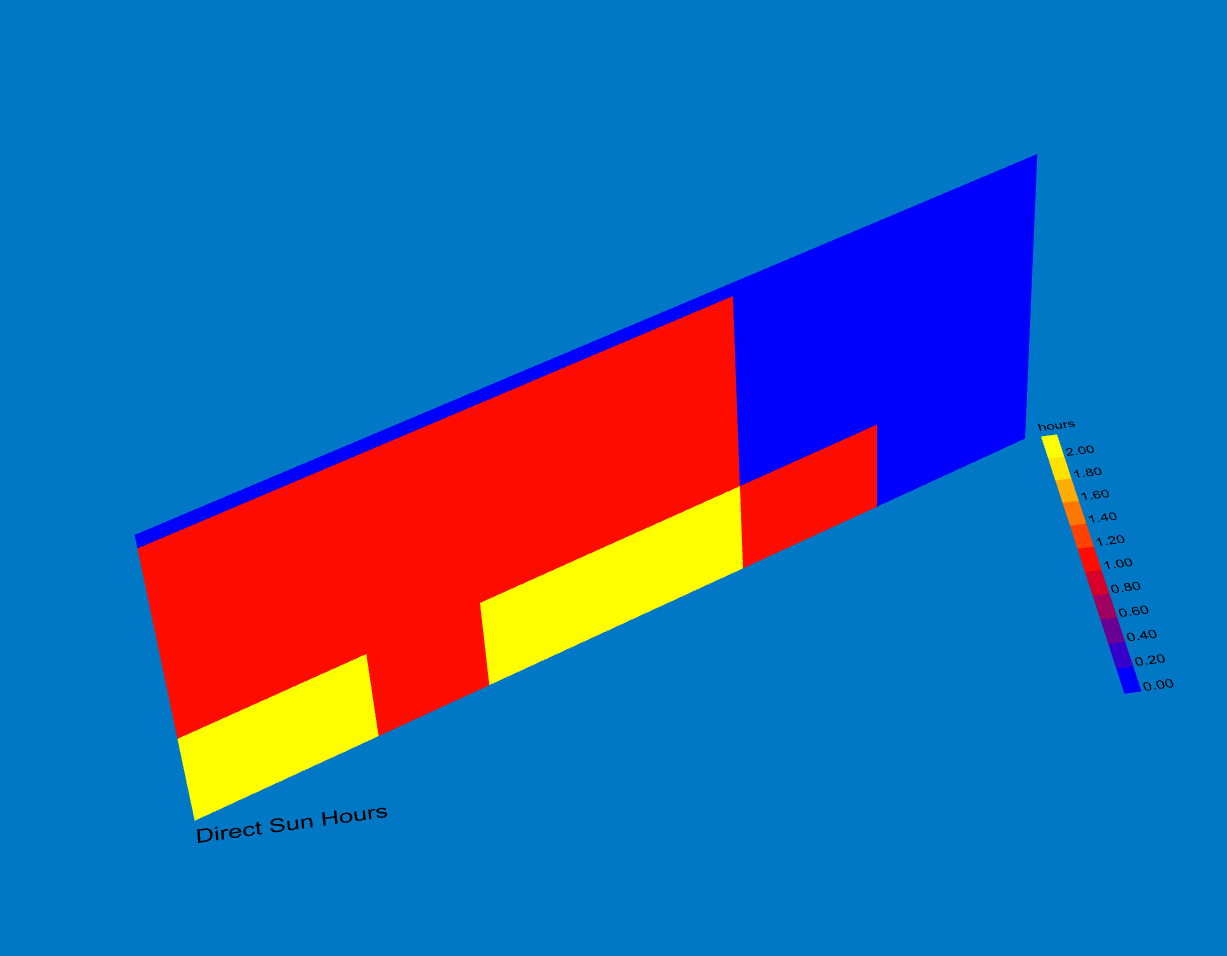
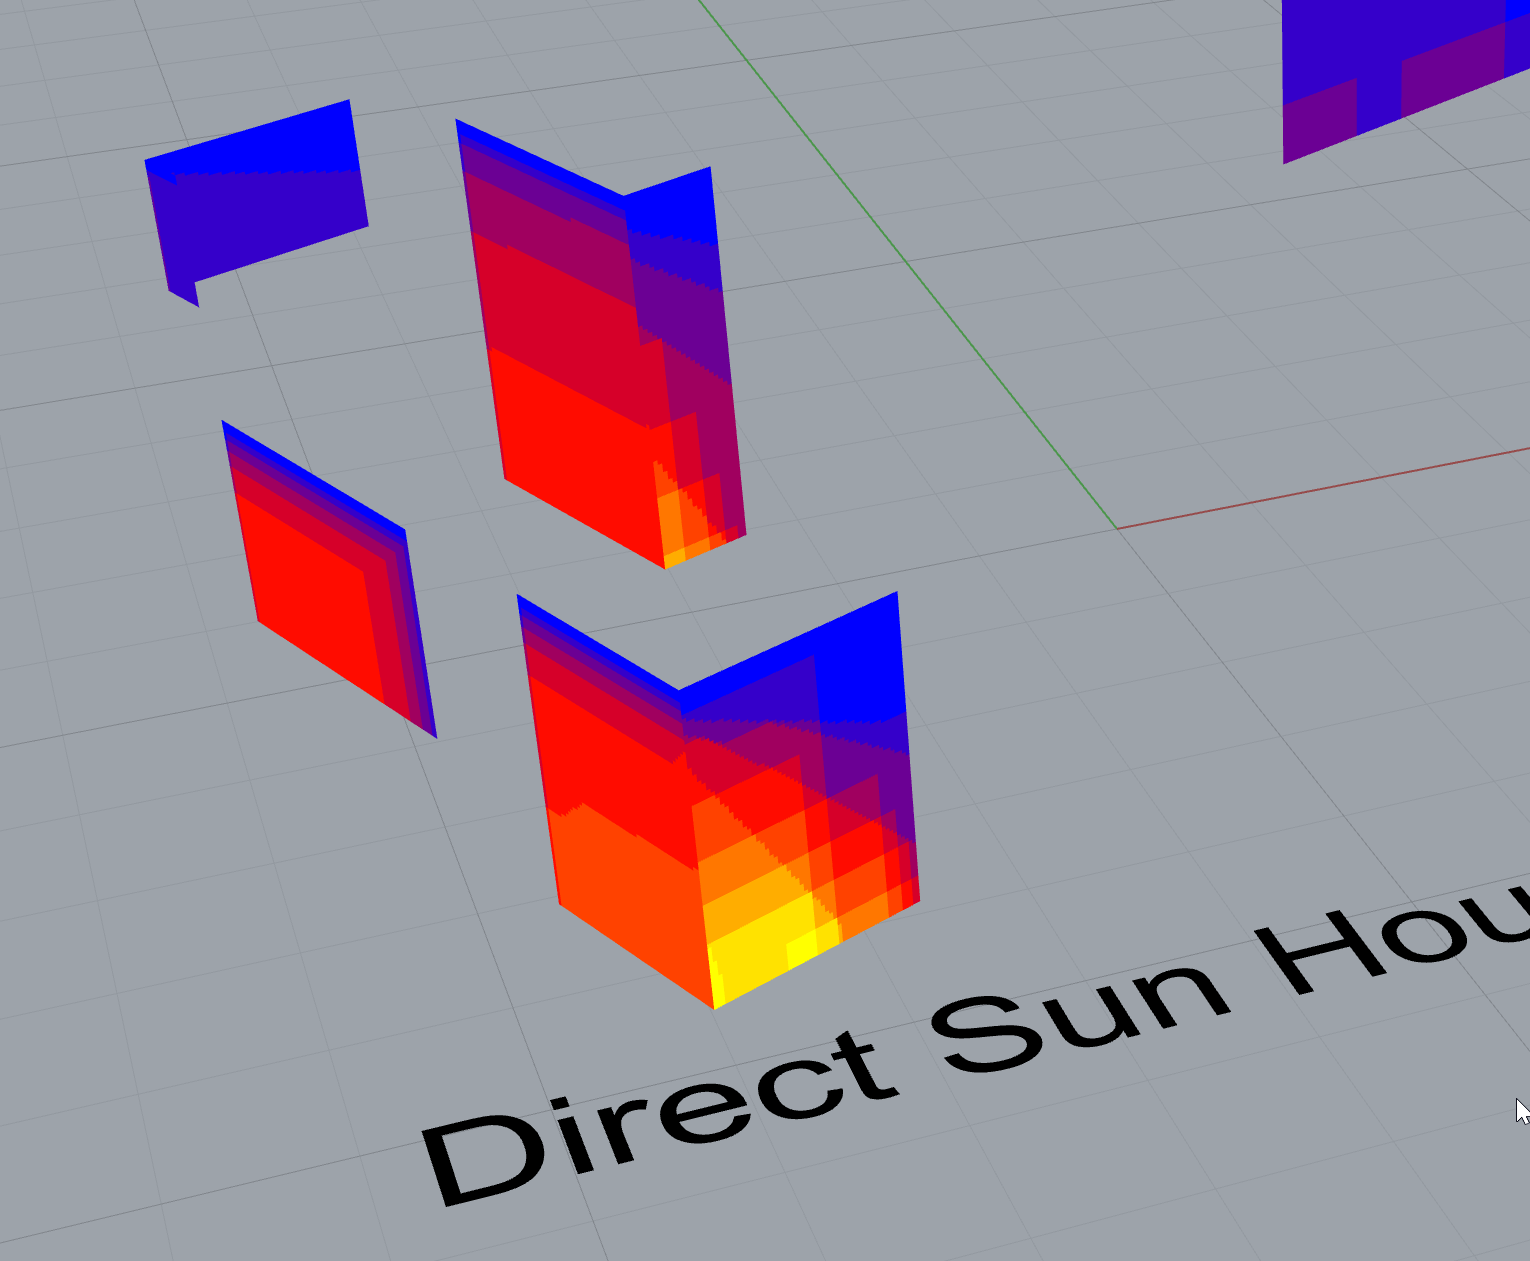
They are not different. The thing is that now each surface has it’s own scale. If you use the legend par component setting the max as 10 (for instance), then you’ll see the same visual results. Don’t get confused by the colors. See what they mean.
As for the rest of your questions, i’m not sure i understand their meaning.
-A.
Thank you @MR_Yuki and @AbrahamYezioro for your guidance and patience. I followed your advice and I made some progress but I am stuck at the next step.
First:
I selected two surfaces from the corner window and clicked “join” in Rhino. Is it enough or I should join them with another tool? There was an error on “DirectSunHours” but I cleared the geometry brep and “set multiple breps” with joined surfaces. I think it looks good.
Because I said what I want to do, not what is the end result I want to achieve. When I started this topic (and the previous one) I thought that the hardest part is data generation, not handling the results.
In short: I want to check if the surrounding buildings affect the number of sun hours the building receives.
To do that, I want to calculate sun hours for every window in the house with
windows as “geometry” and house elements (roofs, walls) as “context”
Then I want to run the calculation with windows as “geometry” and house elements AND surrounding buildings as “context”
By comparing the results I would like to know:
a) does neighbour buildings affect the number of sun hours?
b) if so, what is the difference.
Then I would like to create a simple table which tells how the hours changed for every window.
So far, I can run the calculations for these two states but I don’t know how to treat the results to achive my goal.
Direct answer:
Yes, they do.
They will reduce the direct sun light on your window, consequently can reduce the heat in the room working as an shading element.
The complex:
Depends a lot of the bioclimatic strategy you needs to apply and needs to analyse the lots’ climate. Example: Using the sunligh to heat a closed glassed room to store heat in your home.
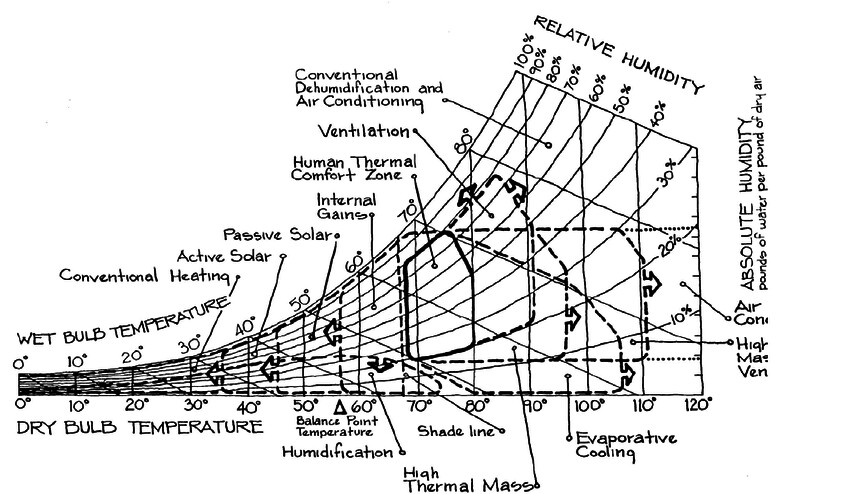
You can use the psychometric chart as reference to check what yours project recommended strategy.
You probably can do both simulations using different sunLightHoursAnalysis components (assuming you are using Legacy, but the same thing for LBT). One without the contet and the second with it. Then you can substract one from the other and get the difference of hours.
-A.
I am back with good news. I got what I wanted. I asked for help from Mr Mikolaj (my local Rhino reseller) and he helped me with sorting the data.
Inspired by @MR_Yuki I dig into requirements and I found that I need maximum values @MR_Yuki suggested earlier. That allowed me to use much simpler methods.
We also did what @AbrahamYezioro suggested. By using “data Recorder” we were able to compare results between different “Context” geometries. That way I found which buildings do affect the sun hours and what is the difference.
I also introduced “60” as a timestep for the analysis period which gave me results in minutes.
I am extremely grateful for your help, patience, and all the explanation you provided.