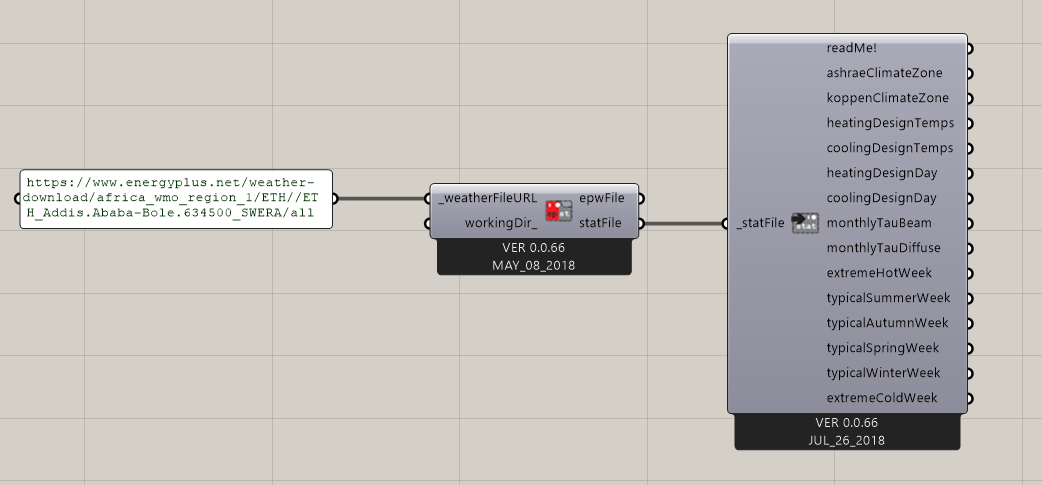
I was looking at the typical weeks from the stat file today and realized, that there are 5 typical weeks in the Ladybug component but 6 in the stat file. At least it was the case for three IWEC weather data sets I looked at. For example here for Munich:
Typical/Extreme Period Determination
Summer is Jul:Sep
Extreme Summer Week (nearest maximum temperature for summer)
Extreme Hot Week Period selected: Jul 22:Jul 28, Maximum Temp= 33.30°C, Deviation=|12.728|°C
Typical Summer Week (nearest average temperature for summer)
Typical Week Period selected: Jul 15:Jul 21, Average Temp= 16.31°C, Deviation=| 0.044|°C
Winter is Jan:Mar
Extreme Winter Week (nearest minimum temperature for winter)
Extreme Cold Week Period selected: Feb 12:Feb 18, Minimum Temp= -16.50°C, Deviation=| 7.038|°C
Typical Winter Week (nearest average temperature for winter)
Typical Week Period selected: Jan 8:Jan 14, Average Temp= -0.04°C, Deviation=| 0.259|°C
Autumn is Oct:Dec
Typical Autumn Week (nearest average temperature for autumn)
Typical Week Period selected: Oct 22:Oct 28, Average Temp= 4.13°C, Deviation=| 0.400|°C
Spring is Apr:Jun
Typical Spring Week (nearest average temperature for spring)
Typical Week Period selected: Apr 1:Apr 7, Average Temp= 11.37°C, Deviation=| 0.291|°C
Is this selection by purpose, that in the Ladybug component the Typical Spring Week is missing?
@davidbriels ,
Sorry for the late response and this is a good question. The reason why the stat component does not output the exact weeks in the file is that not all stat files have the same types of weeks. Some stat files simply have 3 types of weeks: typical week, extreme hot week, and extreme cold week. Others have the 6 different weeks that you indicate here where 4 of the weeks are typical weeks for each of 4 seasons. My inference is that this difference has to do with the fact that some climates don’t neatly fit into the 4-season categorization (they might just have two seasons like wet / dry).
In any case, outputting 5 weeks gives us a setup that works with both types of files. If you have a suggestion of a better way of dealing with this, we are definitely open to revising the components.
thanks for the response. I got it, then I coincidentally found three stat files with 6 typical weeks. But isn´t it possible to output all typical weeks and name them like in the stat file? For example at Munich:
Typical / Extreme Summer Week
Typical / Extreme Winter Week
Typical Autumn Week
Typical Spring Week
And in case of a stat file with less typical weeks leave out the missing ones?
But I´m not familiar with coding, so I don´t know if that´s not too complicated.
hi, I would like to ask if i can define myself the typical week period by using this tool? As the summer is defined from July to September, I would like to define it June to August. and it may generate a new typical summer week period.
@tphao.bnuep ,
Ladybug isn’t doing any calculations to get these weeks. They are written into the stat files themselves. I think that the stat files are generated using one of the utilities in E+ so, if you need to see what the heuristic method code is like, you should check the E_ source code.