Hi. I’m a student working on my Passive Strategy simulation. Just wanna ask assistance on how to fix my overlapping Adaptive Comfort chart. The model is a 2 story townhouse with rooms on top of each other. I’ve tried the fix from Multiple charts https://discourse.ladybug.tools/t/adaptive-comfort-tool-reconciling-input-from-multiple-zones/1932/4?u=hana.lemon to no avail.
Also, a newbie question but what’s the difference between LB Adaptive and LB Adaptive Chart? Which is better indicative for Adaptive Comfort after running a OSM Simulation?
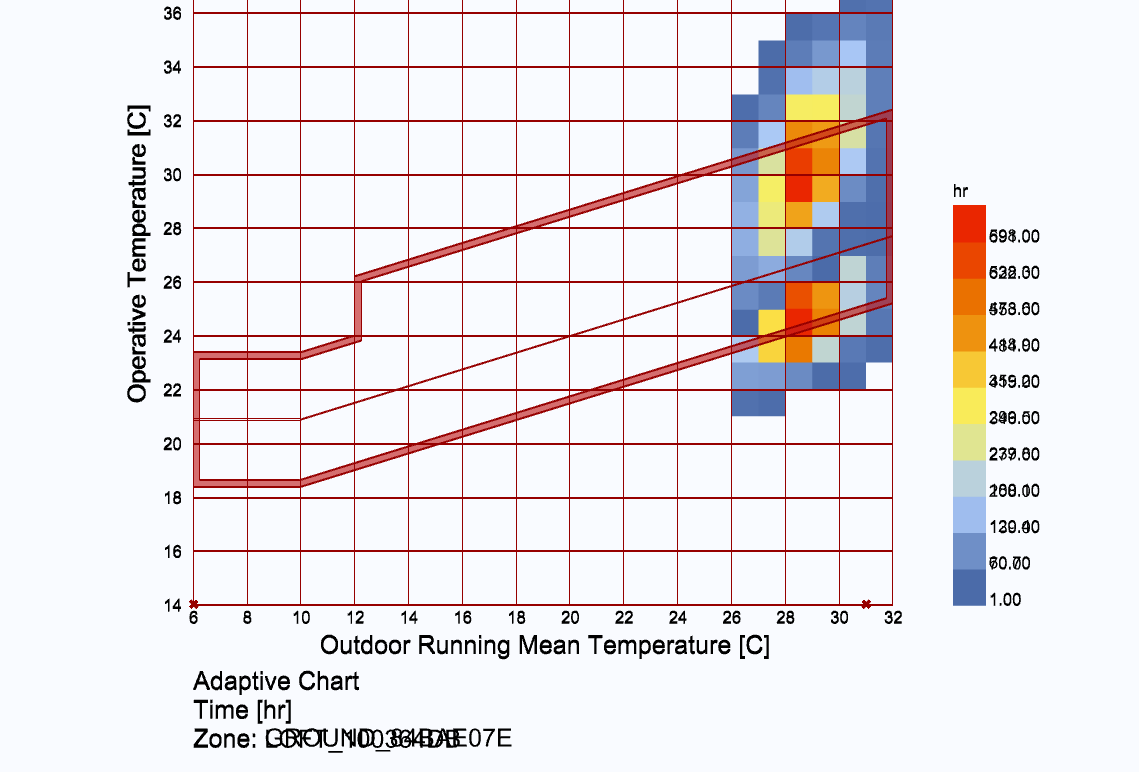
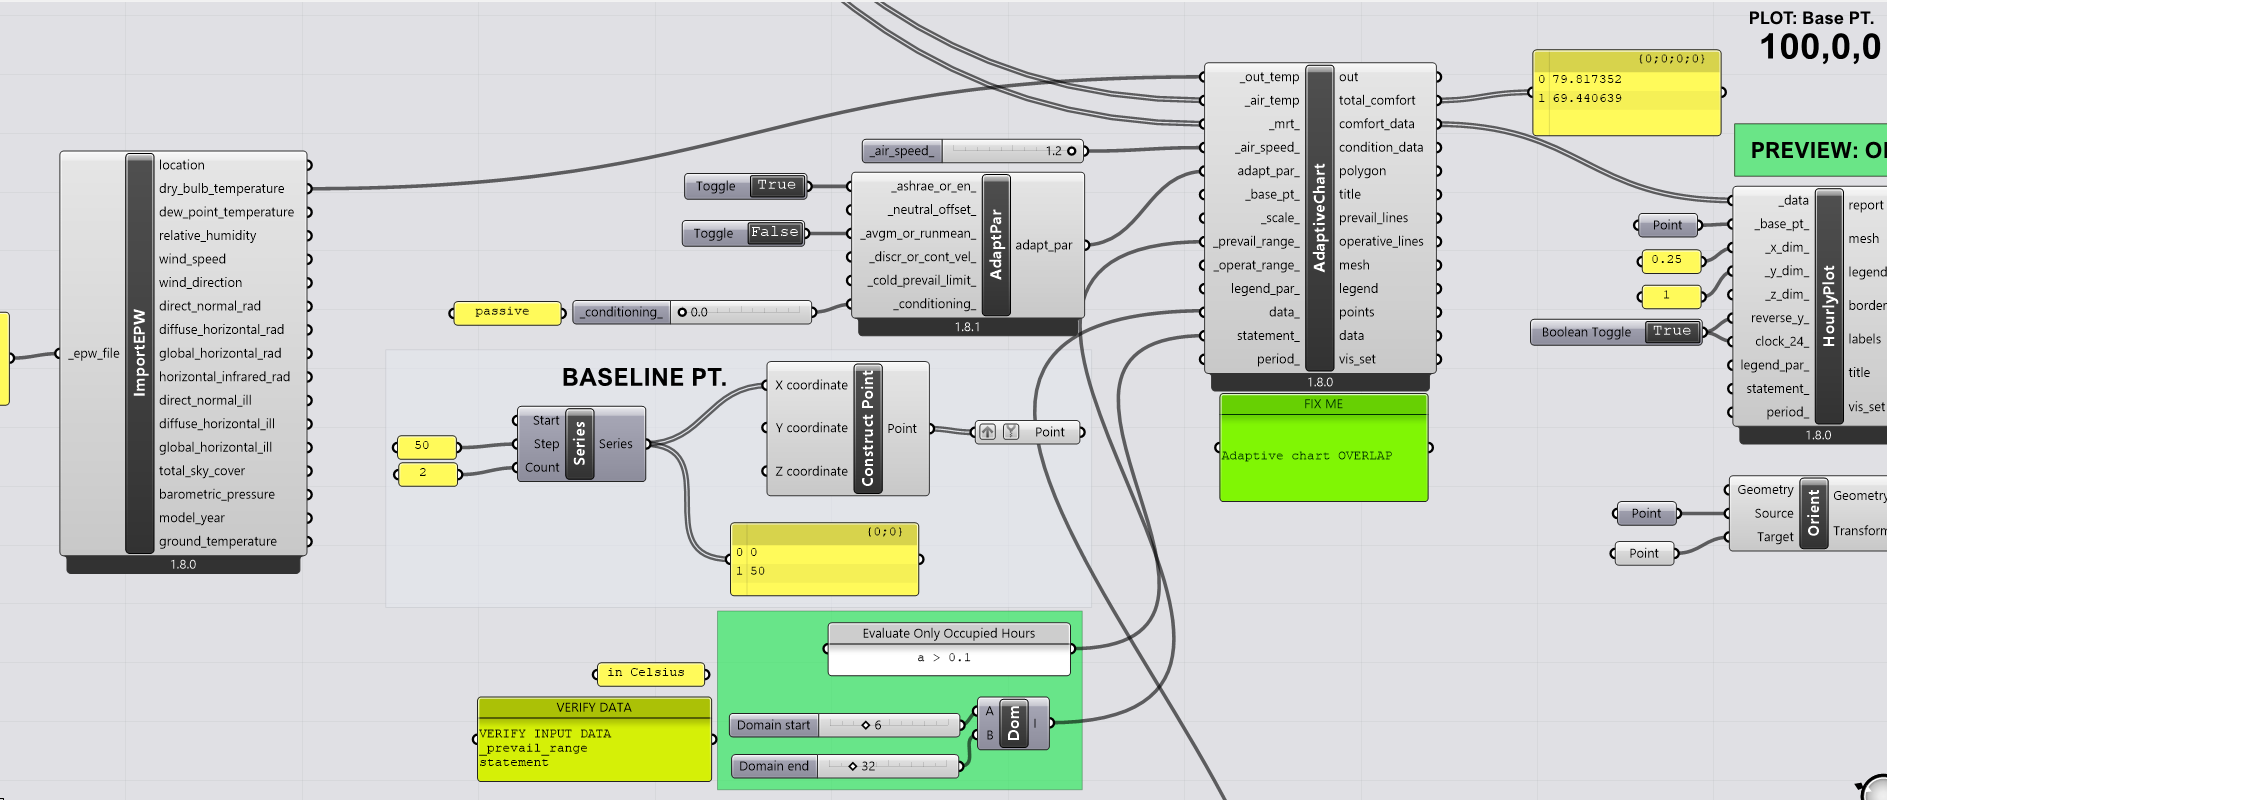
As a new user, I can’t attached files but here’s a screenshot. Hope for any leads.
Thanks!
Hana