I was remaking the Durnial Monthly Mean Min Max Chart found in Hydra with the LB V 1.1.0 components and i noticed two things:
-
that when you attach temp data and radiation data the custom colors for the legend parameter component don’t seem to be translating through.
-
That the Comfort Model and the bldgBalancept inputs are missing along with the comfort band and legend outputs.
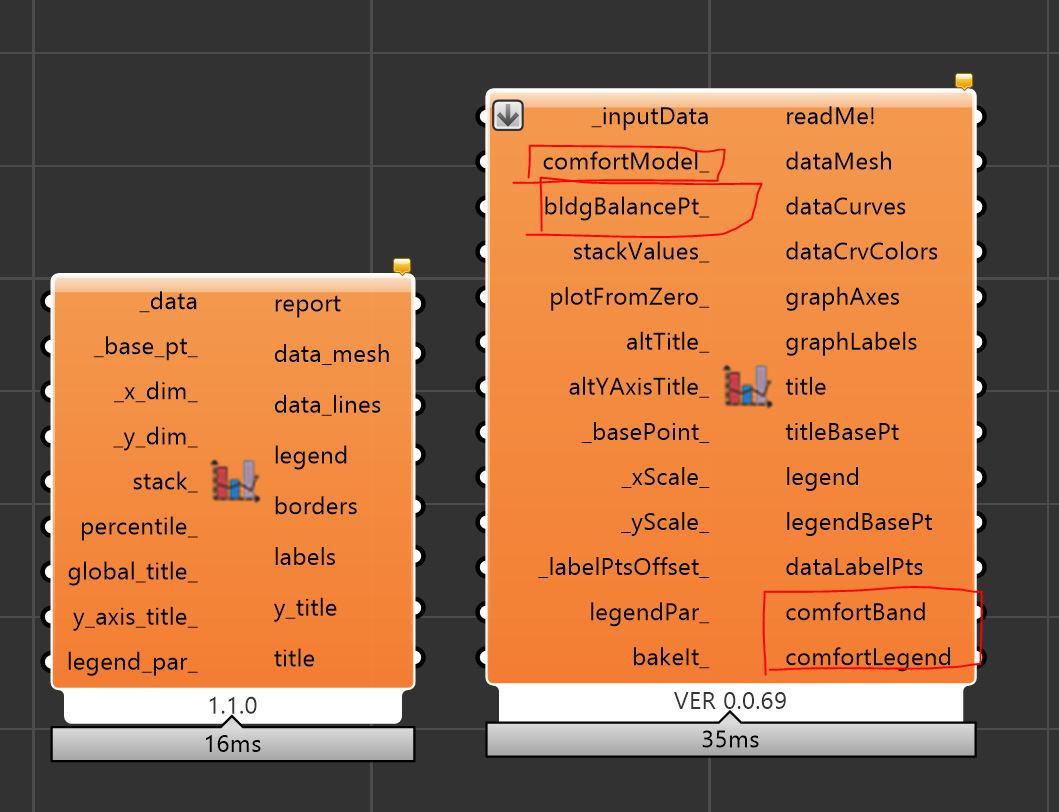
Will those be getting added later? were the replaced with something else? or are they gone for good?
Thank you,
Chris