For a new user, you are using a very old version of the plugin and so I would recommend installing the new LBT 1.4 plugin.
Still, if you are looking for an average radiation value, you can plug that list of results into a native Grasshopper Average component. If you are more concerned about the total solar energy falling on the surface instead of the average, you can use the total radiation that is output directly from the radiation component.
Hi.
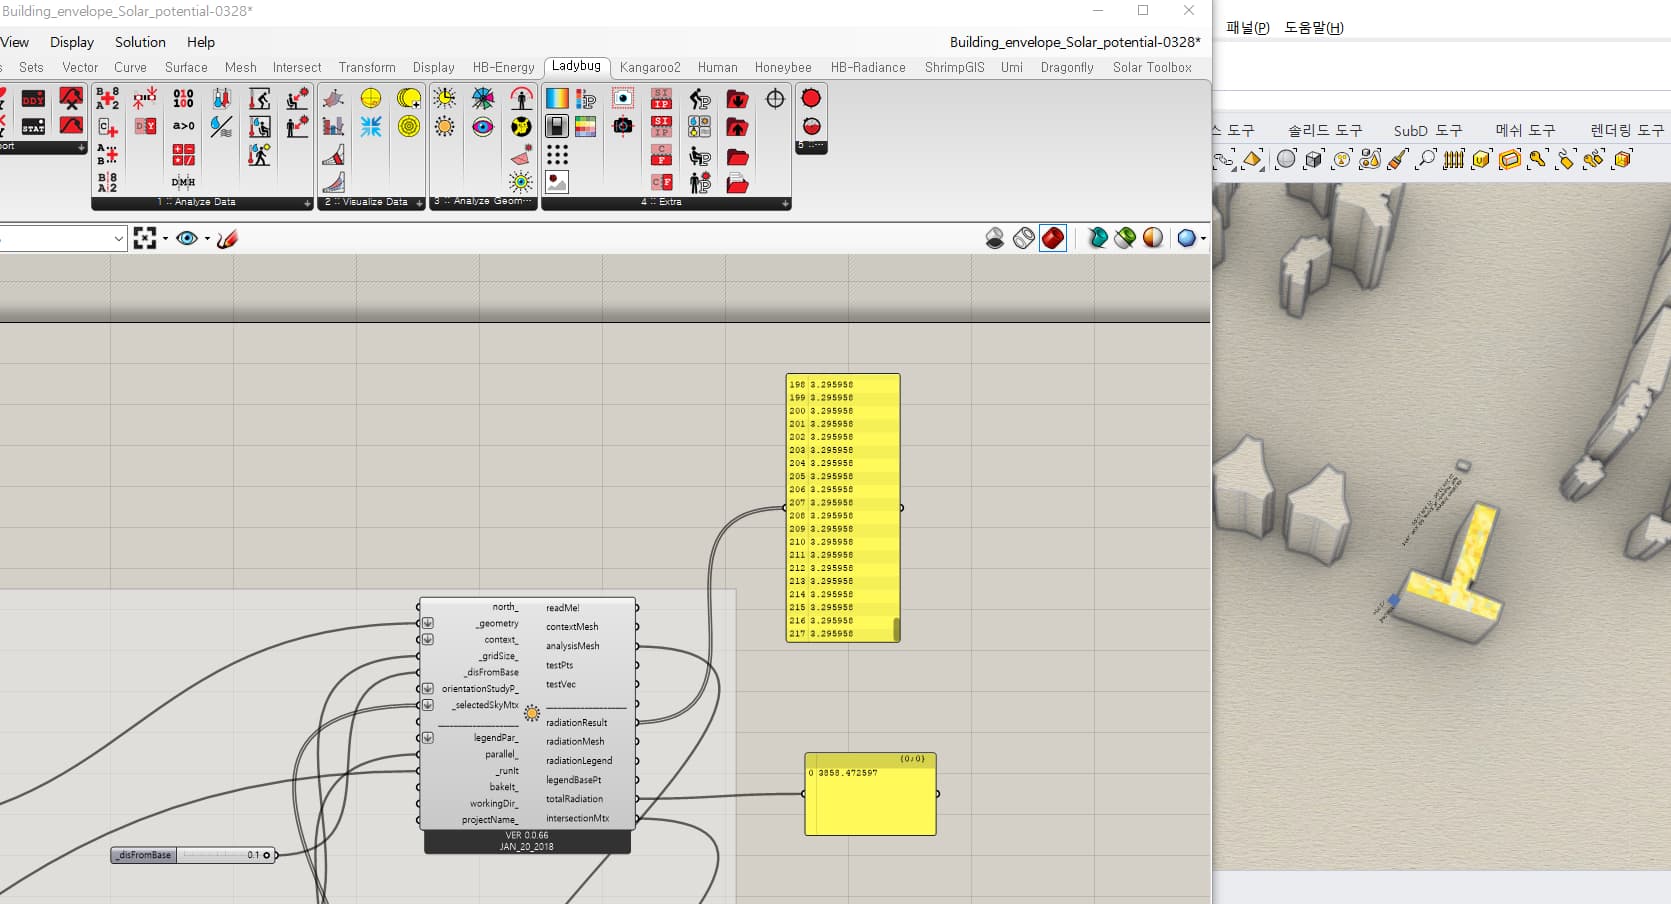
I have a doubt regarding the calculation output for solar radiation. Are the obtained values an annual average or total annual incoming radiation for each surface?
Please see the image attached for reference. I am getting quite high numbers.
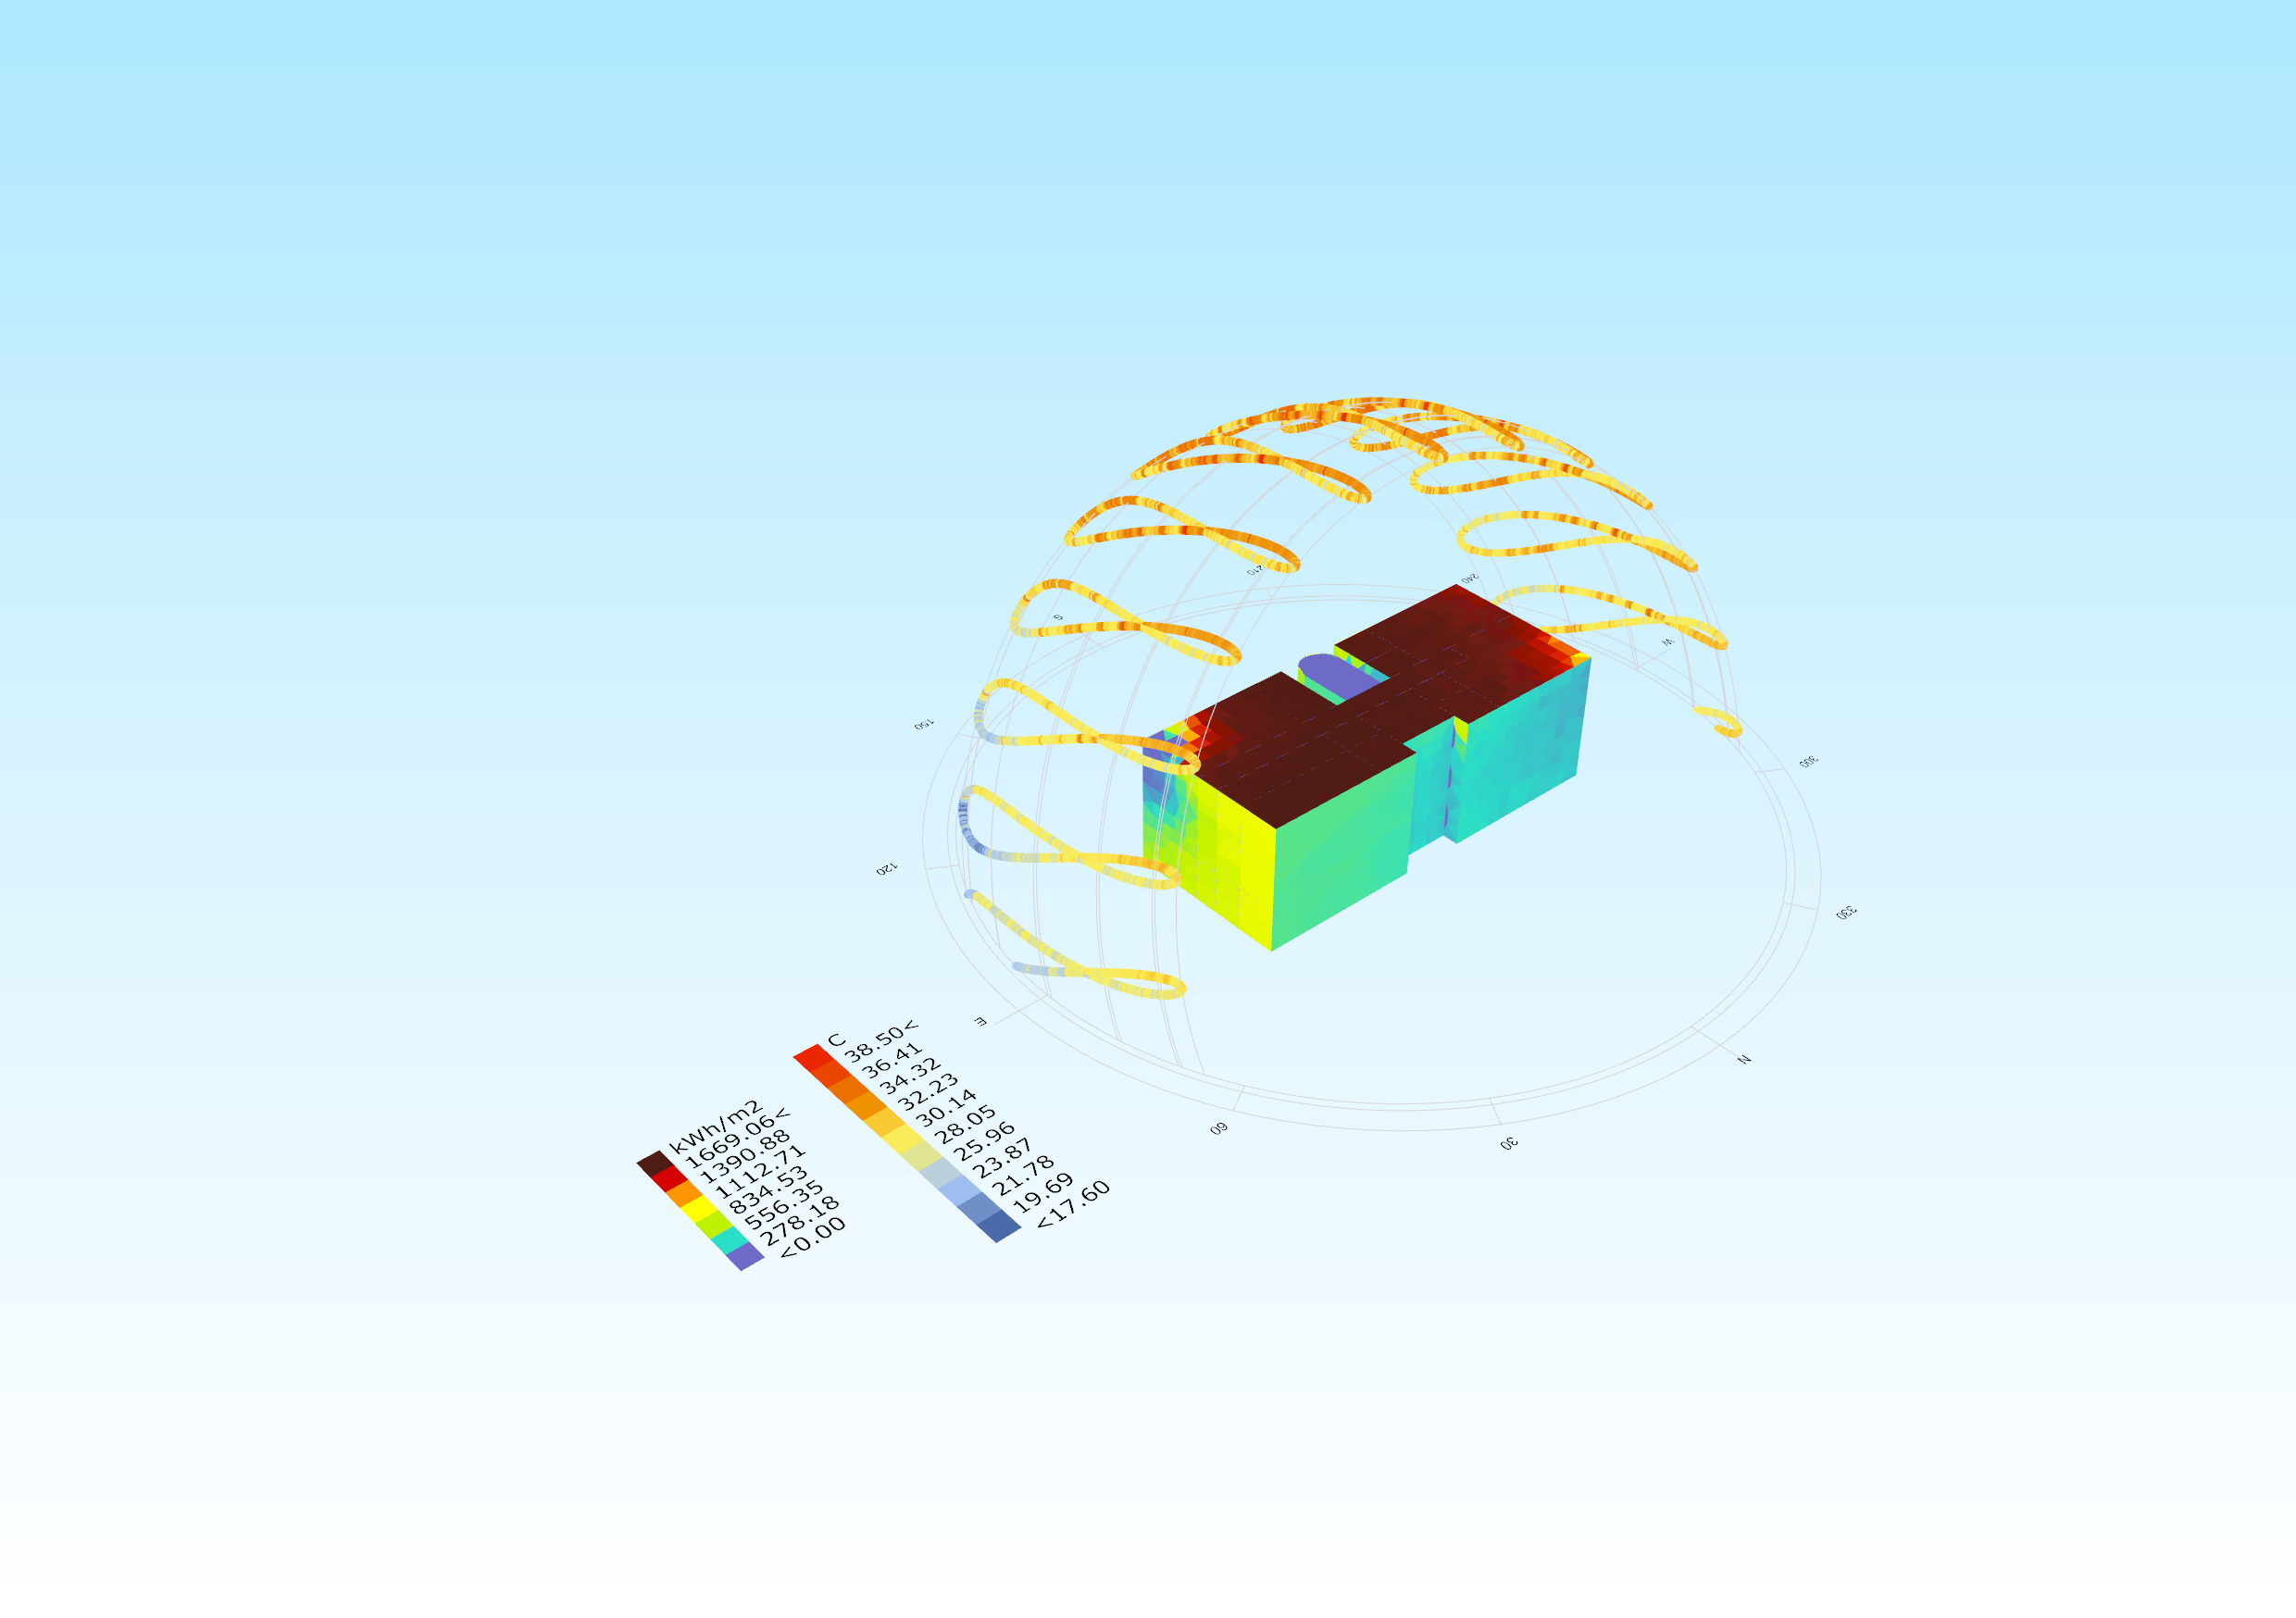
Judging by your scale that seems correct to me for an annual average for a horizontal surface. Riyadh is around 2200 kWh/m2/yr, Greece around 1800 kWh/m2/yr.
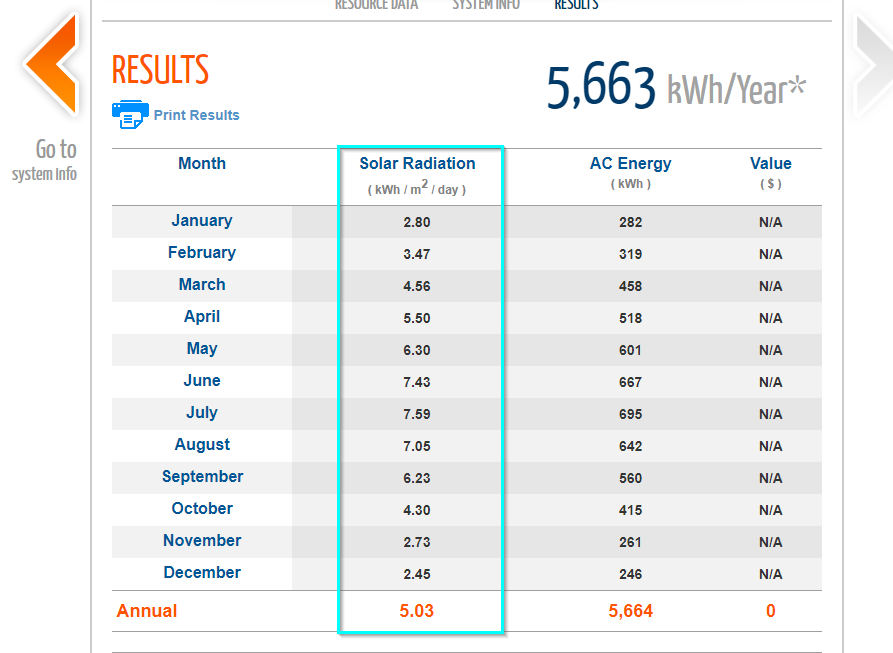
You could also sum hourly global horizontal radiation values from you epw to see what result that gets, or I’ll often also look at pvwatts to get a value from another source (if you click through to the end you get daily average kWh/m2, which you can multiply by 365 to give annual) https://pvwatts.nrel.gov/
Hi Charlie
Thank you so much for your response.
I think I have a very basic mathematical doubt.
“Judging by your scale that seems correct to me for an annual average for a horizontal surface. Riyadh is around 2200 kWh/m2/yr, Greece around 1800 kWh/m2/yr.”
So the annual average would be Total Annual Radiation/ 12 (which in my case came out to be around 2200 kWh/ m2/ month). This is a yearly average but very much similar to the examples mentioned by you (which are values for a year).
Based on this context, I can come up with two things:
Either the output values are for a complete year and not an annual average. 2200 kWh/ m sq. would be extremely high for a month, else