Hello to all
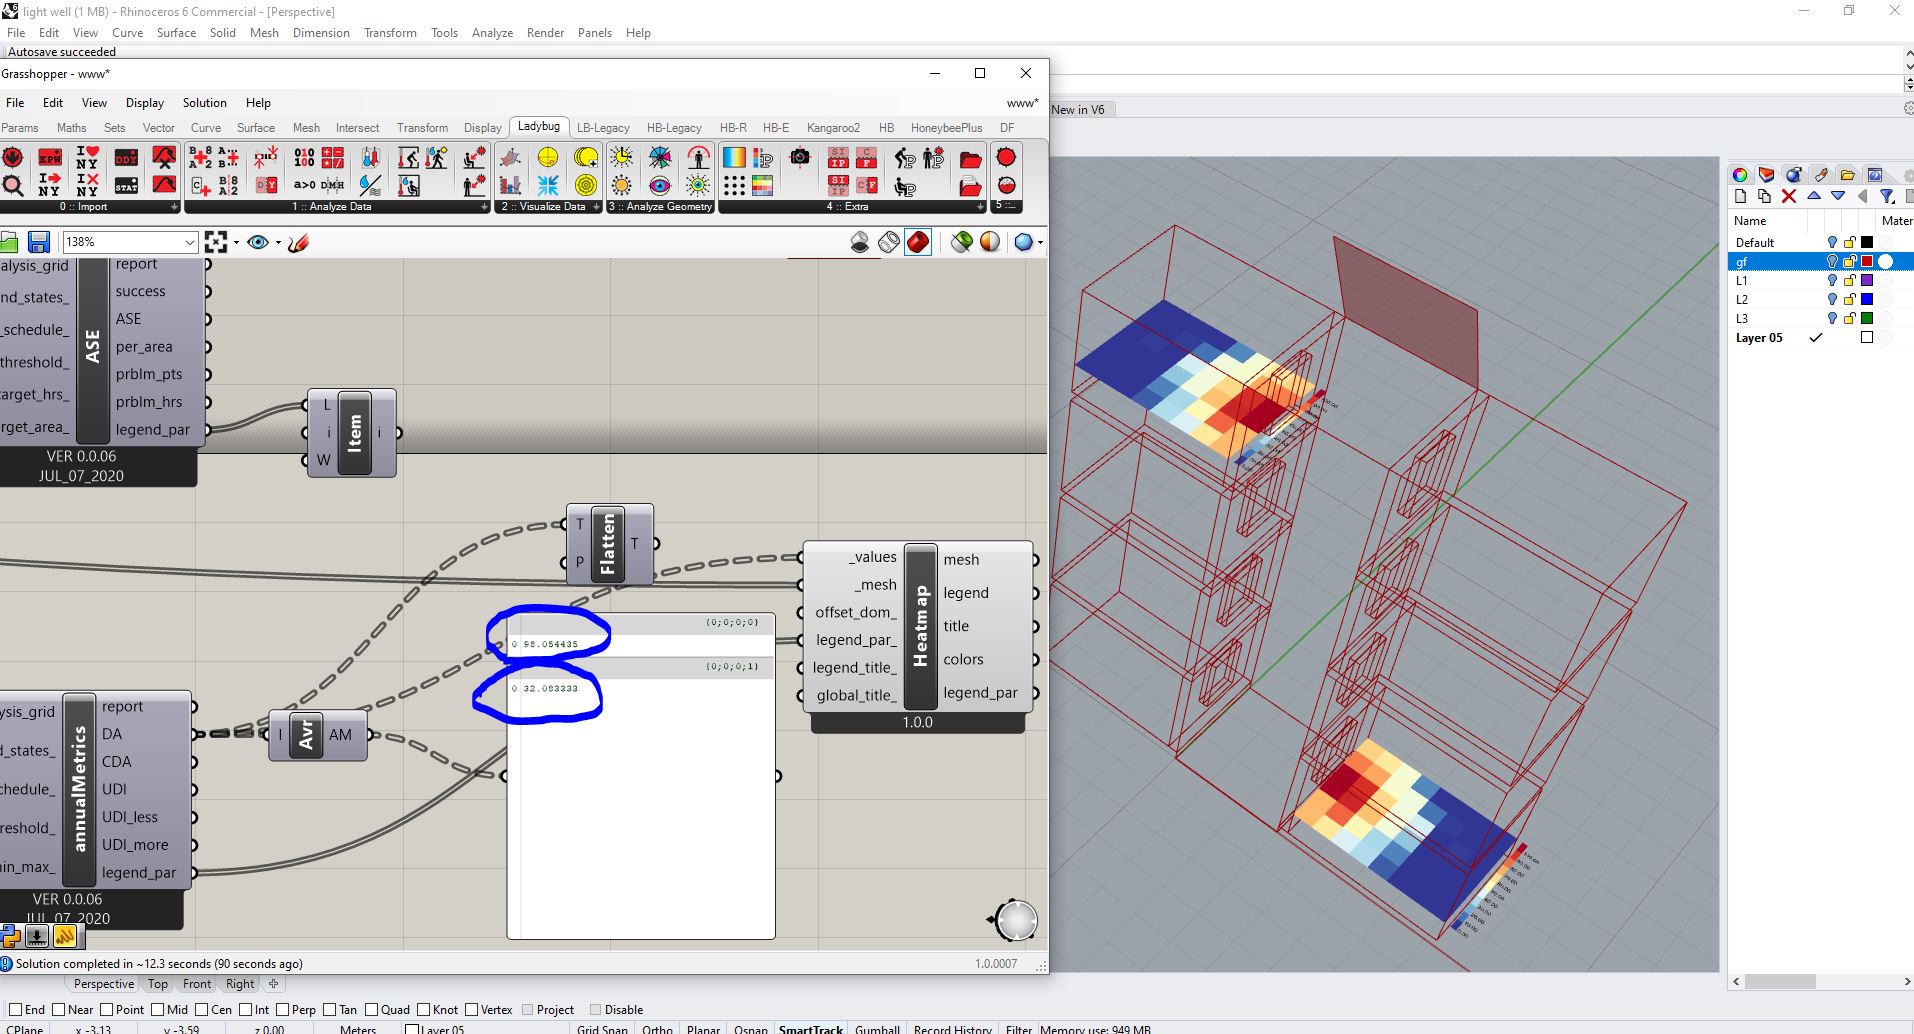
In the annual daylight simulation inn hb+, the amount of daylight autonomy in the floors varies greatly. But why, when we connect the LB Spatial Heatmap to Annual Daylight Metrics, the display graphics are exactly the same in each floor. So that, in visualization, this difference should be understood graphically.
I guess the LB Spatial Heatmap does not match the Annual Daylight Metrics values.
Does anyone know what causes this problem? anuual +.gh (616.6 KB)
@Aliarch ,
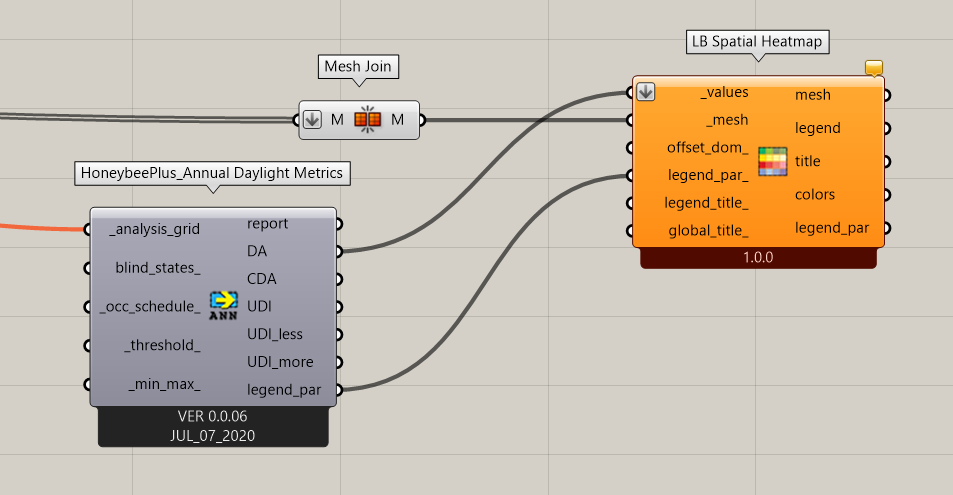
This is because you have two separate legends with different min/max for each mesh. You can join them into one mesh and flatten the results to get one legend for both meshes: